
2025 is all about brand building. At Ahrefs, we’ve already been doing that for over a decade, but there’s never been a better time for us to ramp things up.
After writing an article on 11 ways to measure brand awareness, I figured now’s also the perfect time for us to get a clearer picture of where we stand today, so we have something solid to measure against when those brand wins come rolling in 😉
I needed a reliable way to track Ahrefs’ brand performance—regularly and over time.
Luckily for me, we already have a Looker Studio Template hooked up to all our main tools via the API, which made it easy to create a live, auto-updating dashboard of the key organic brand metrics I cared about.
Below, I show you exactly how to replicate this for your own brand.
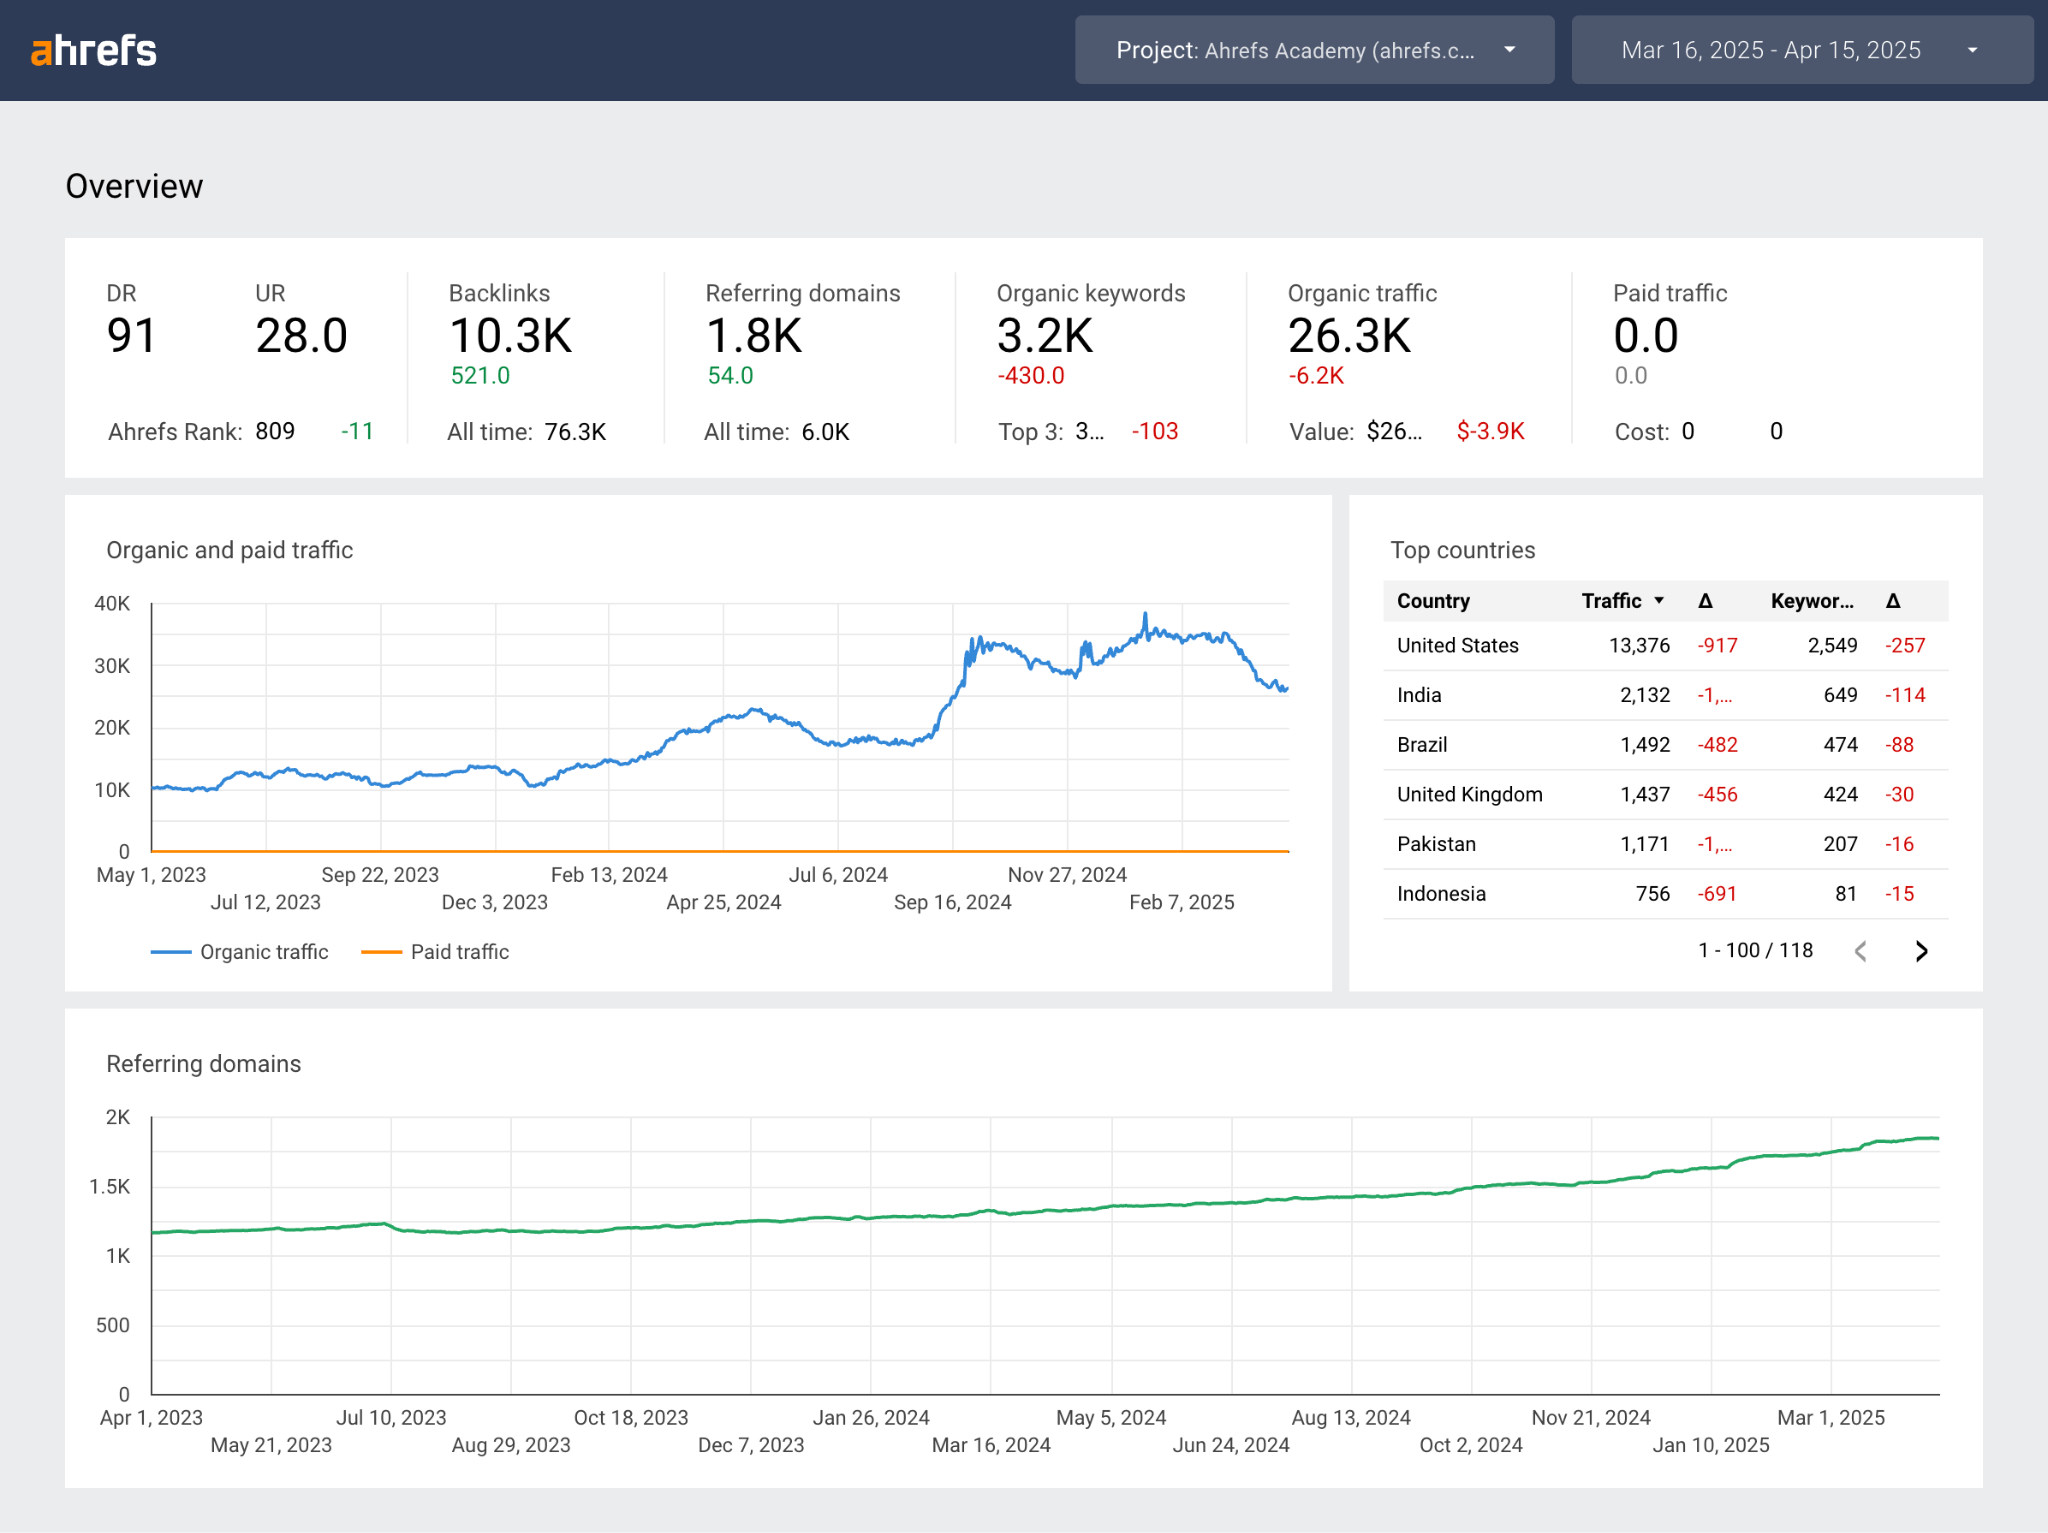
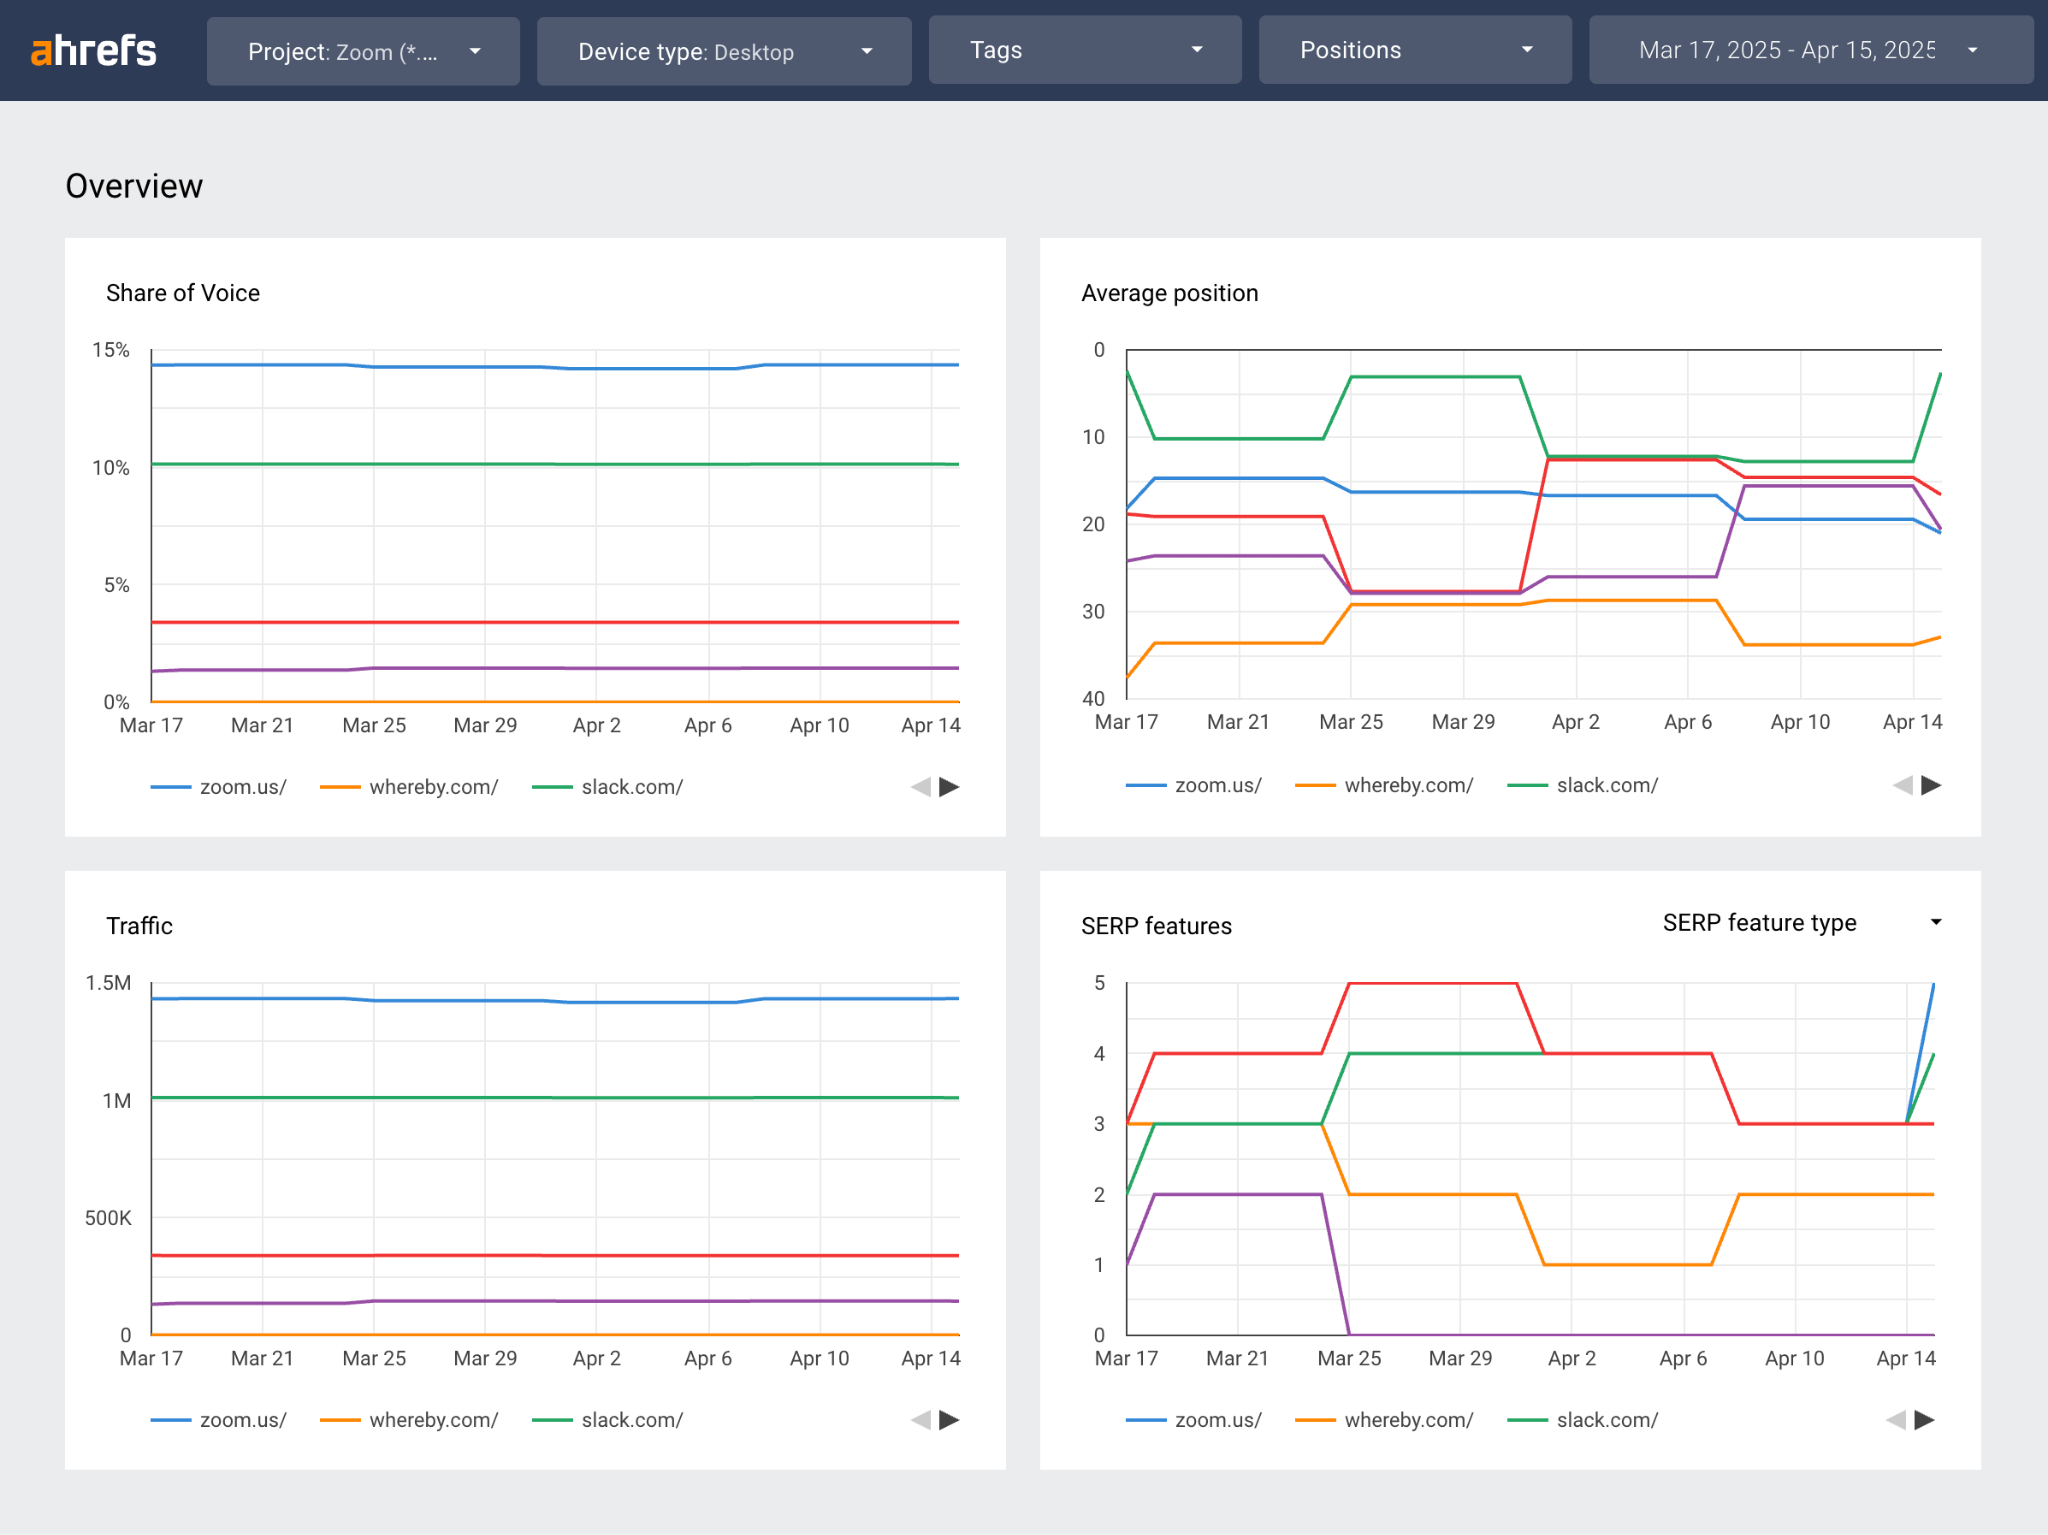
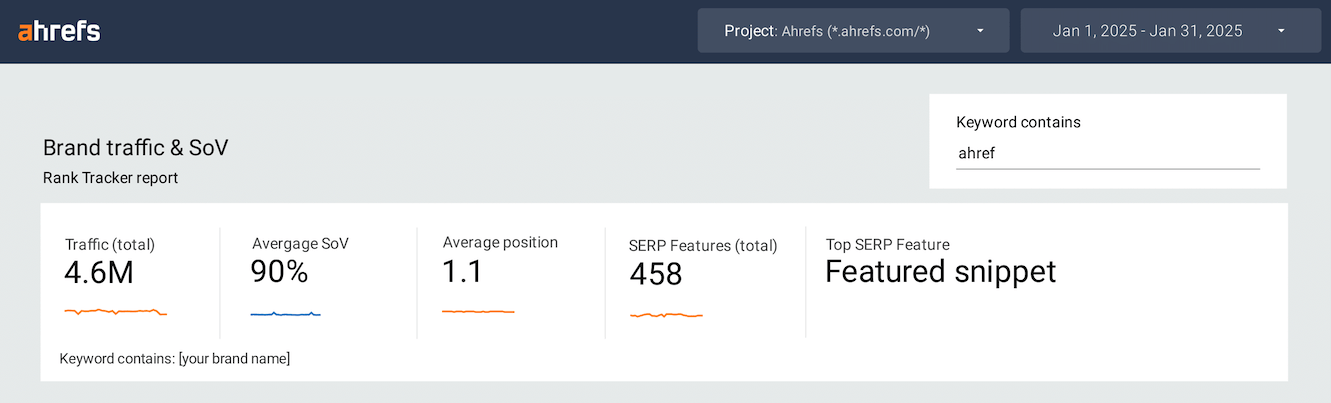
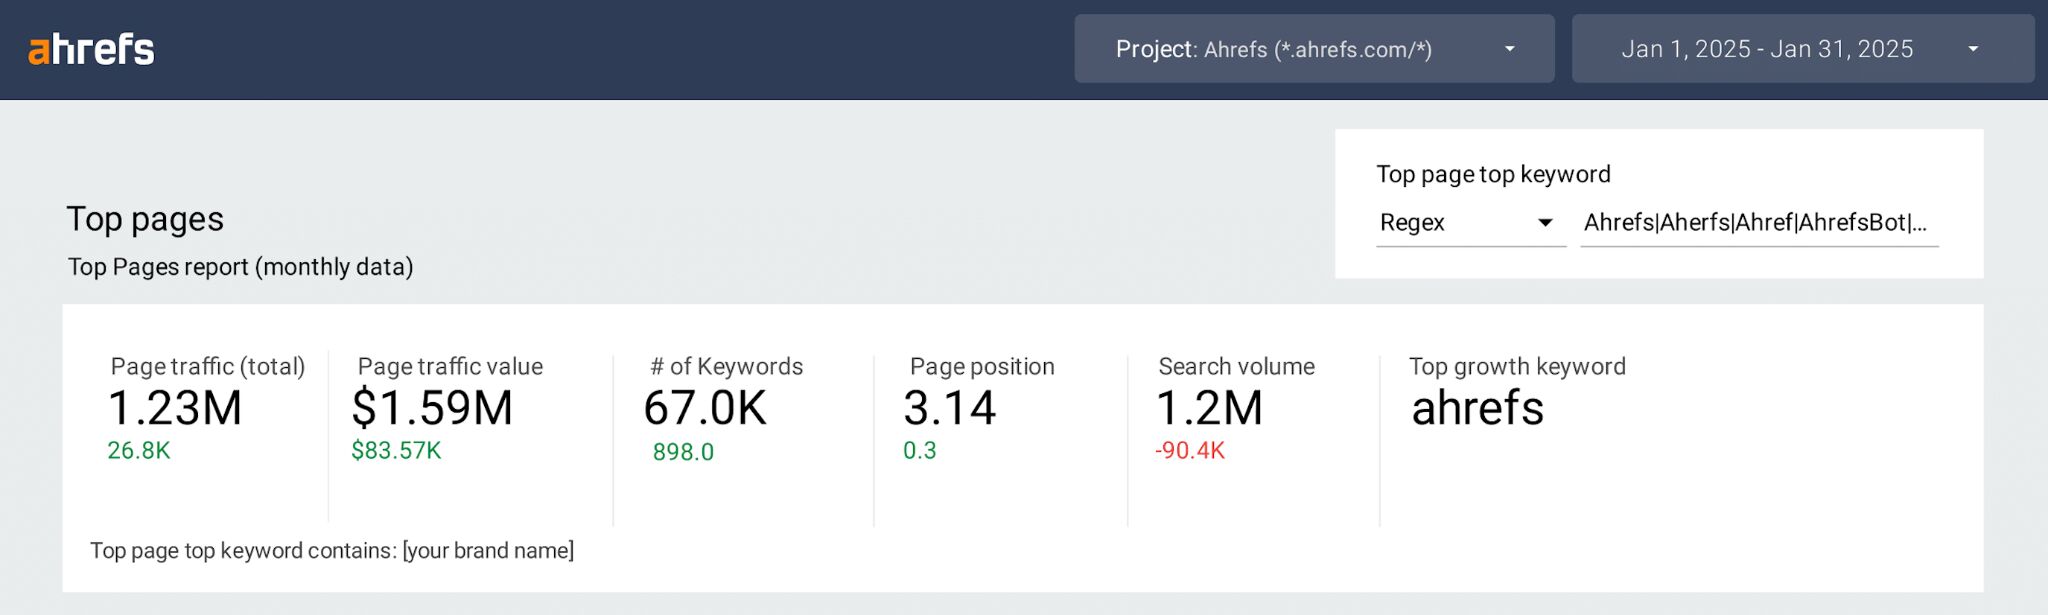
I created a high-level view of how “visible” the Ahrefs brand is in organic search.
I started off by playing around with existing data in Ahrefs’ pre-made Looker Studio templates.
This gave me an idea of how to configure the data, until I eventually found my favorite brand analysis datapoints.
Here’s a quick snapshot of the data I analyzed:
- Branded traffic over time and Share of Voice (SoV) for branded keywords
- Top pages and how they’re contributing to branded traffic
- Branded keyword performance (volume, CPC, ranking)
- The location and quality of branded backlinks
- New/lost branded backlinks
- Branded SERP feature ownership
Here are 7 steps to measuring your own organic brand performance in Looker Studio.
The easiest way to create your own LS dashboard is to adapt one of our three templates.
Site Explorer is best for keeping tabs on total organic traffic, paid traffic, organic keywords, and backlinks.
Rank Tracker is useful for overview stats and project-level analysis. It helps you track SoV against competitors, SERP Feature ownership, and positions across a specific set of keywords.
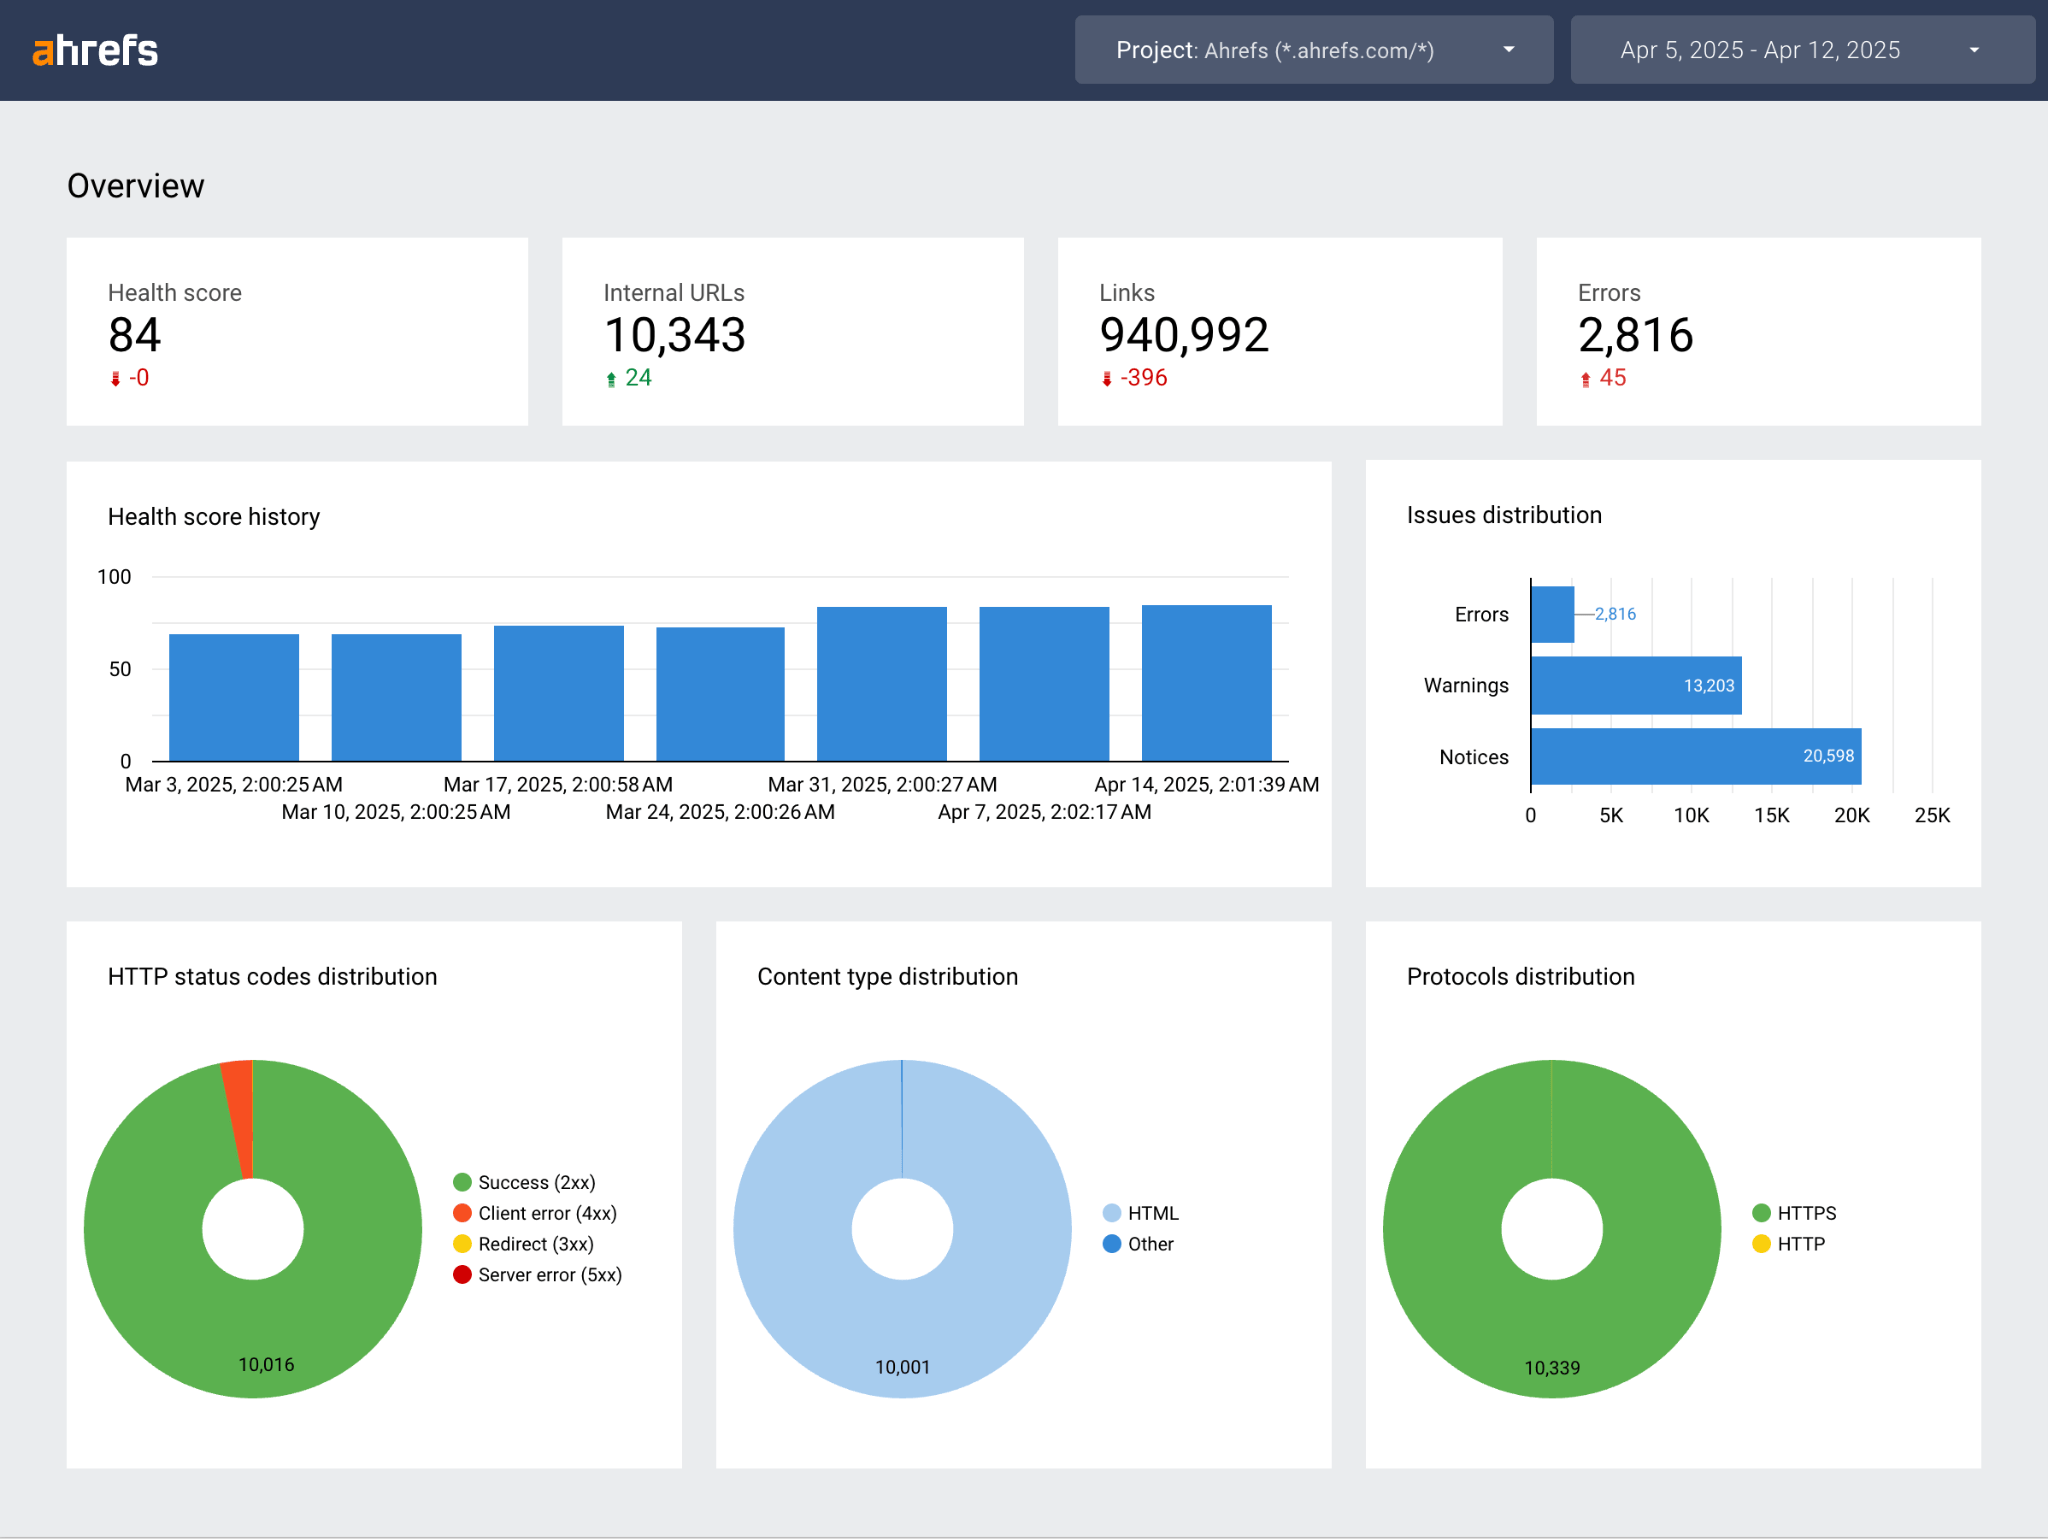
Site Audit is useful when you want to go deep into the technical SEO side of things. It gives you indexability insights, on-page content issues, and core web vitals status updates.
I mostly wanted to monitor broad brand metrics, so I started off with the Site Explorer template, and then fed in Rank Tracker data to home-in on some of our most important keywords.
To adapt a template, just click on the three dots on the right and click “Make a copy”.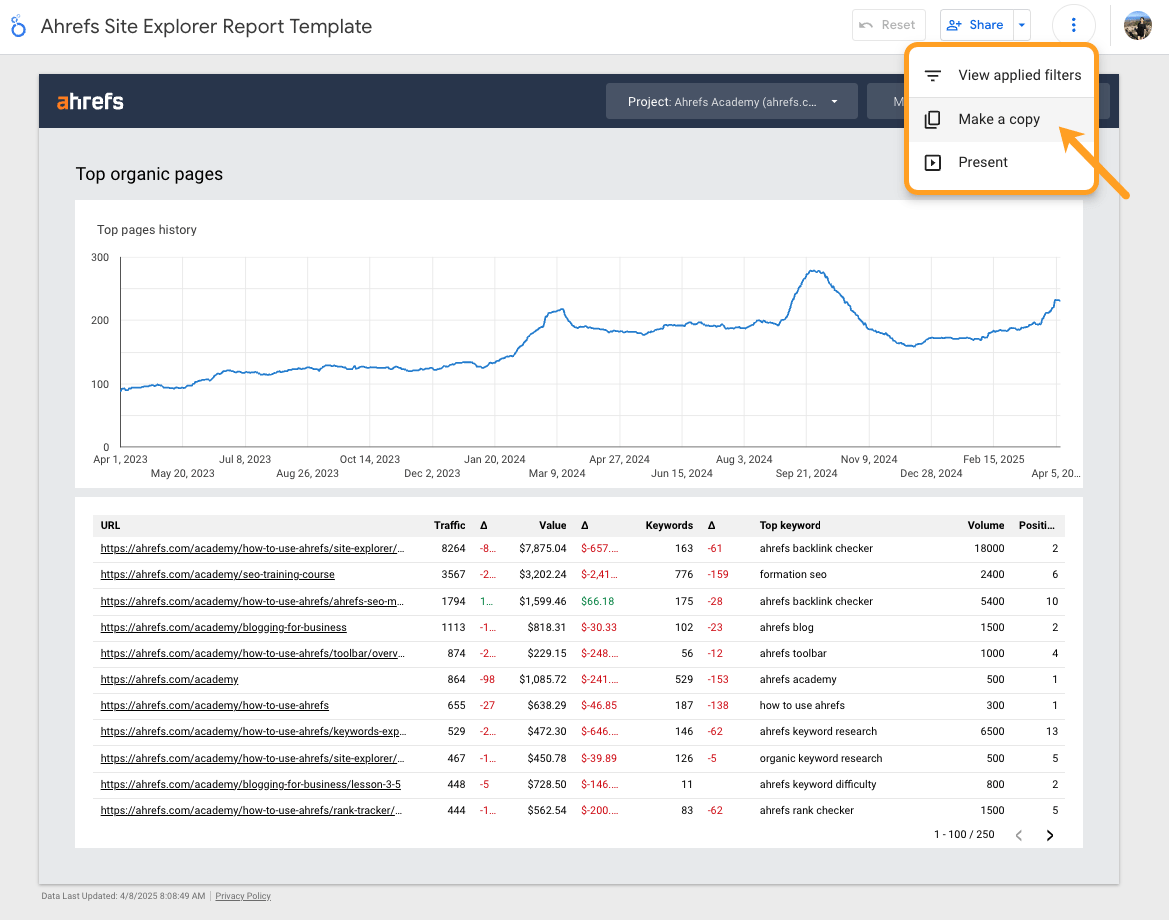
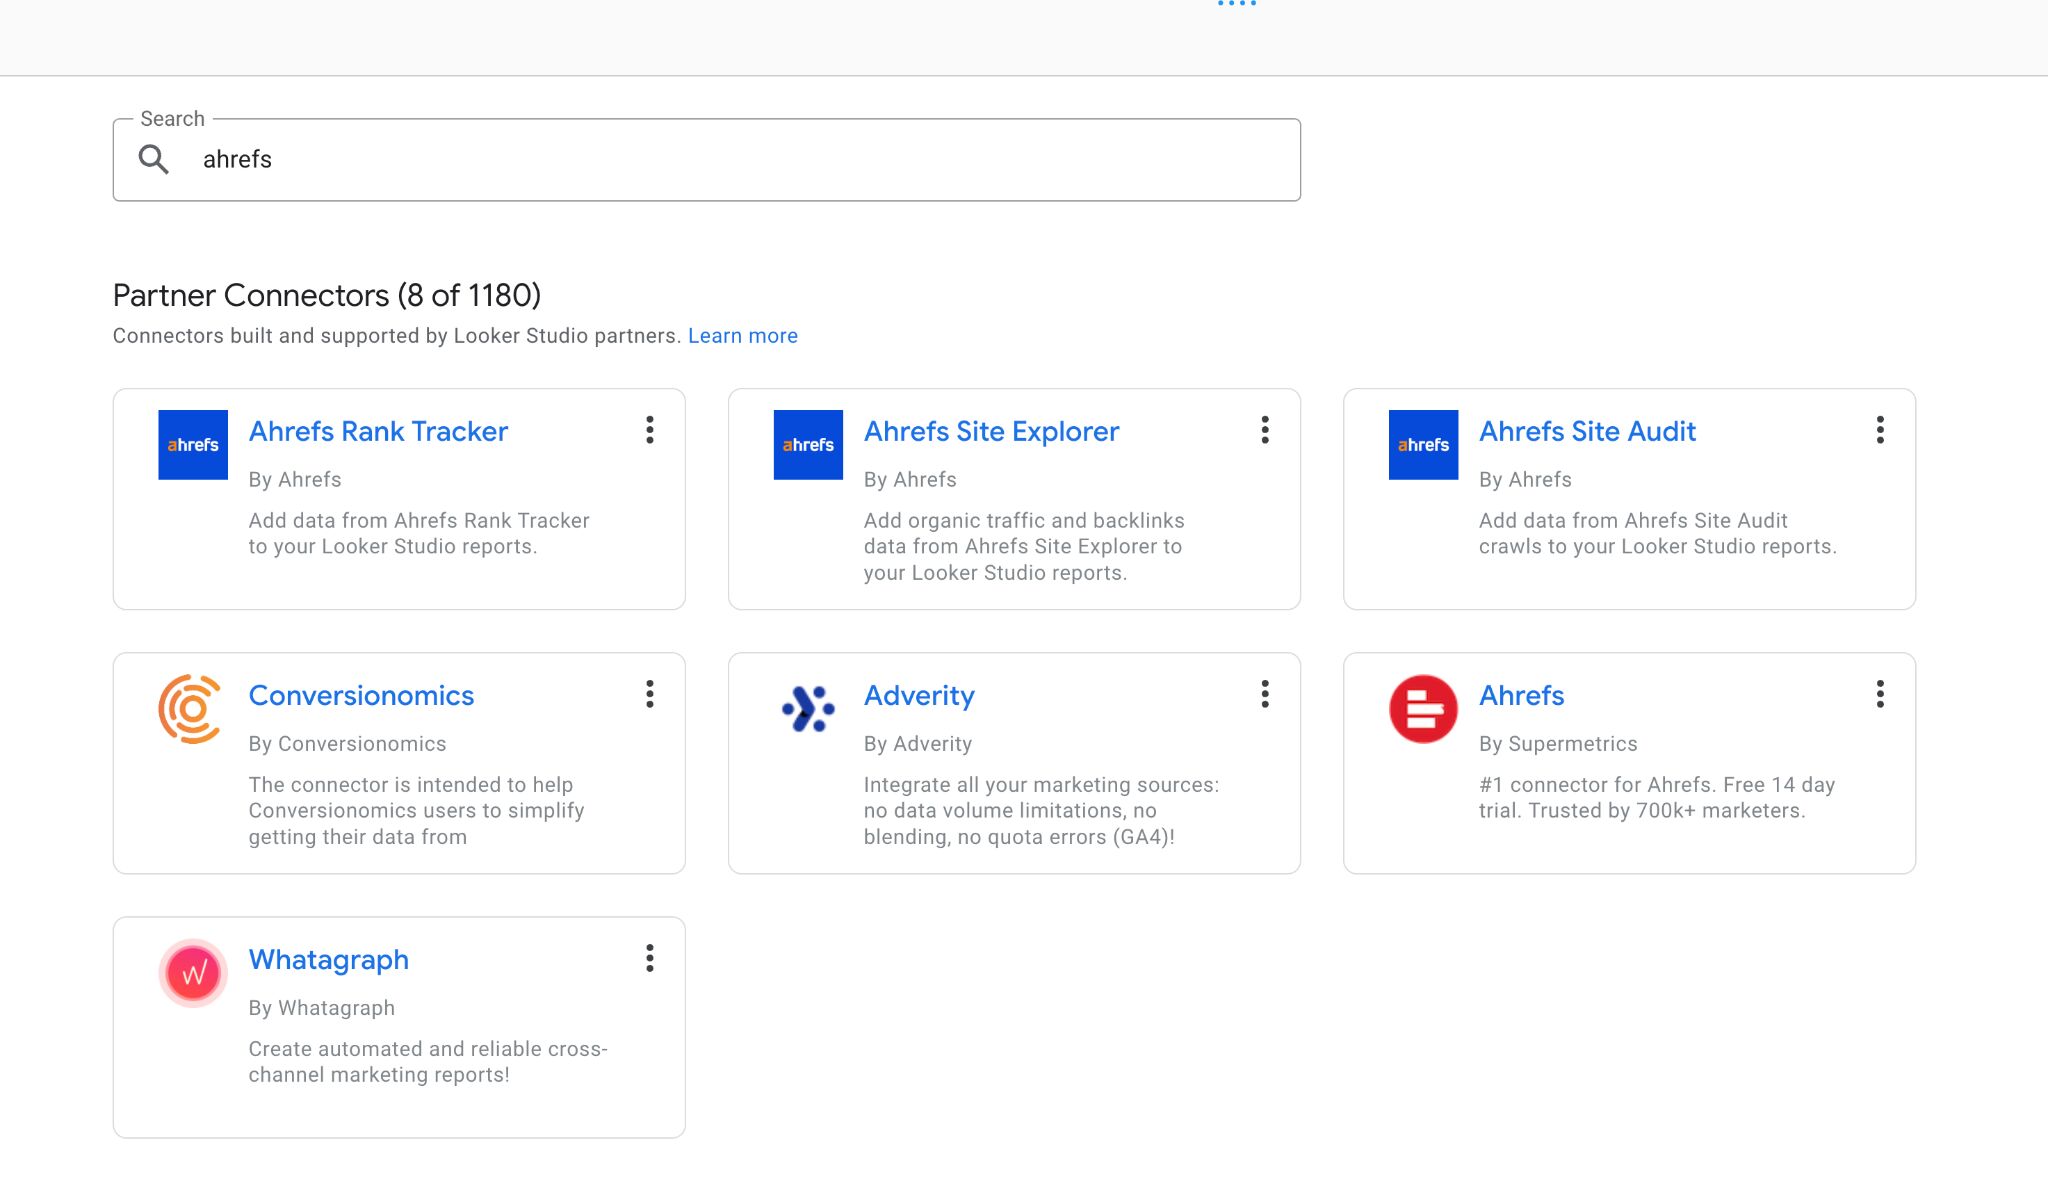
Then under “New data source” click “Create data source”…
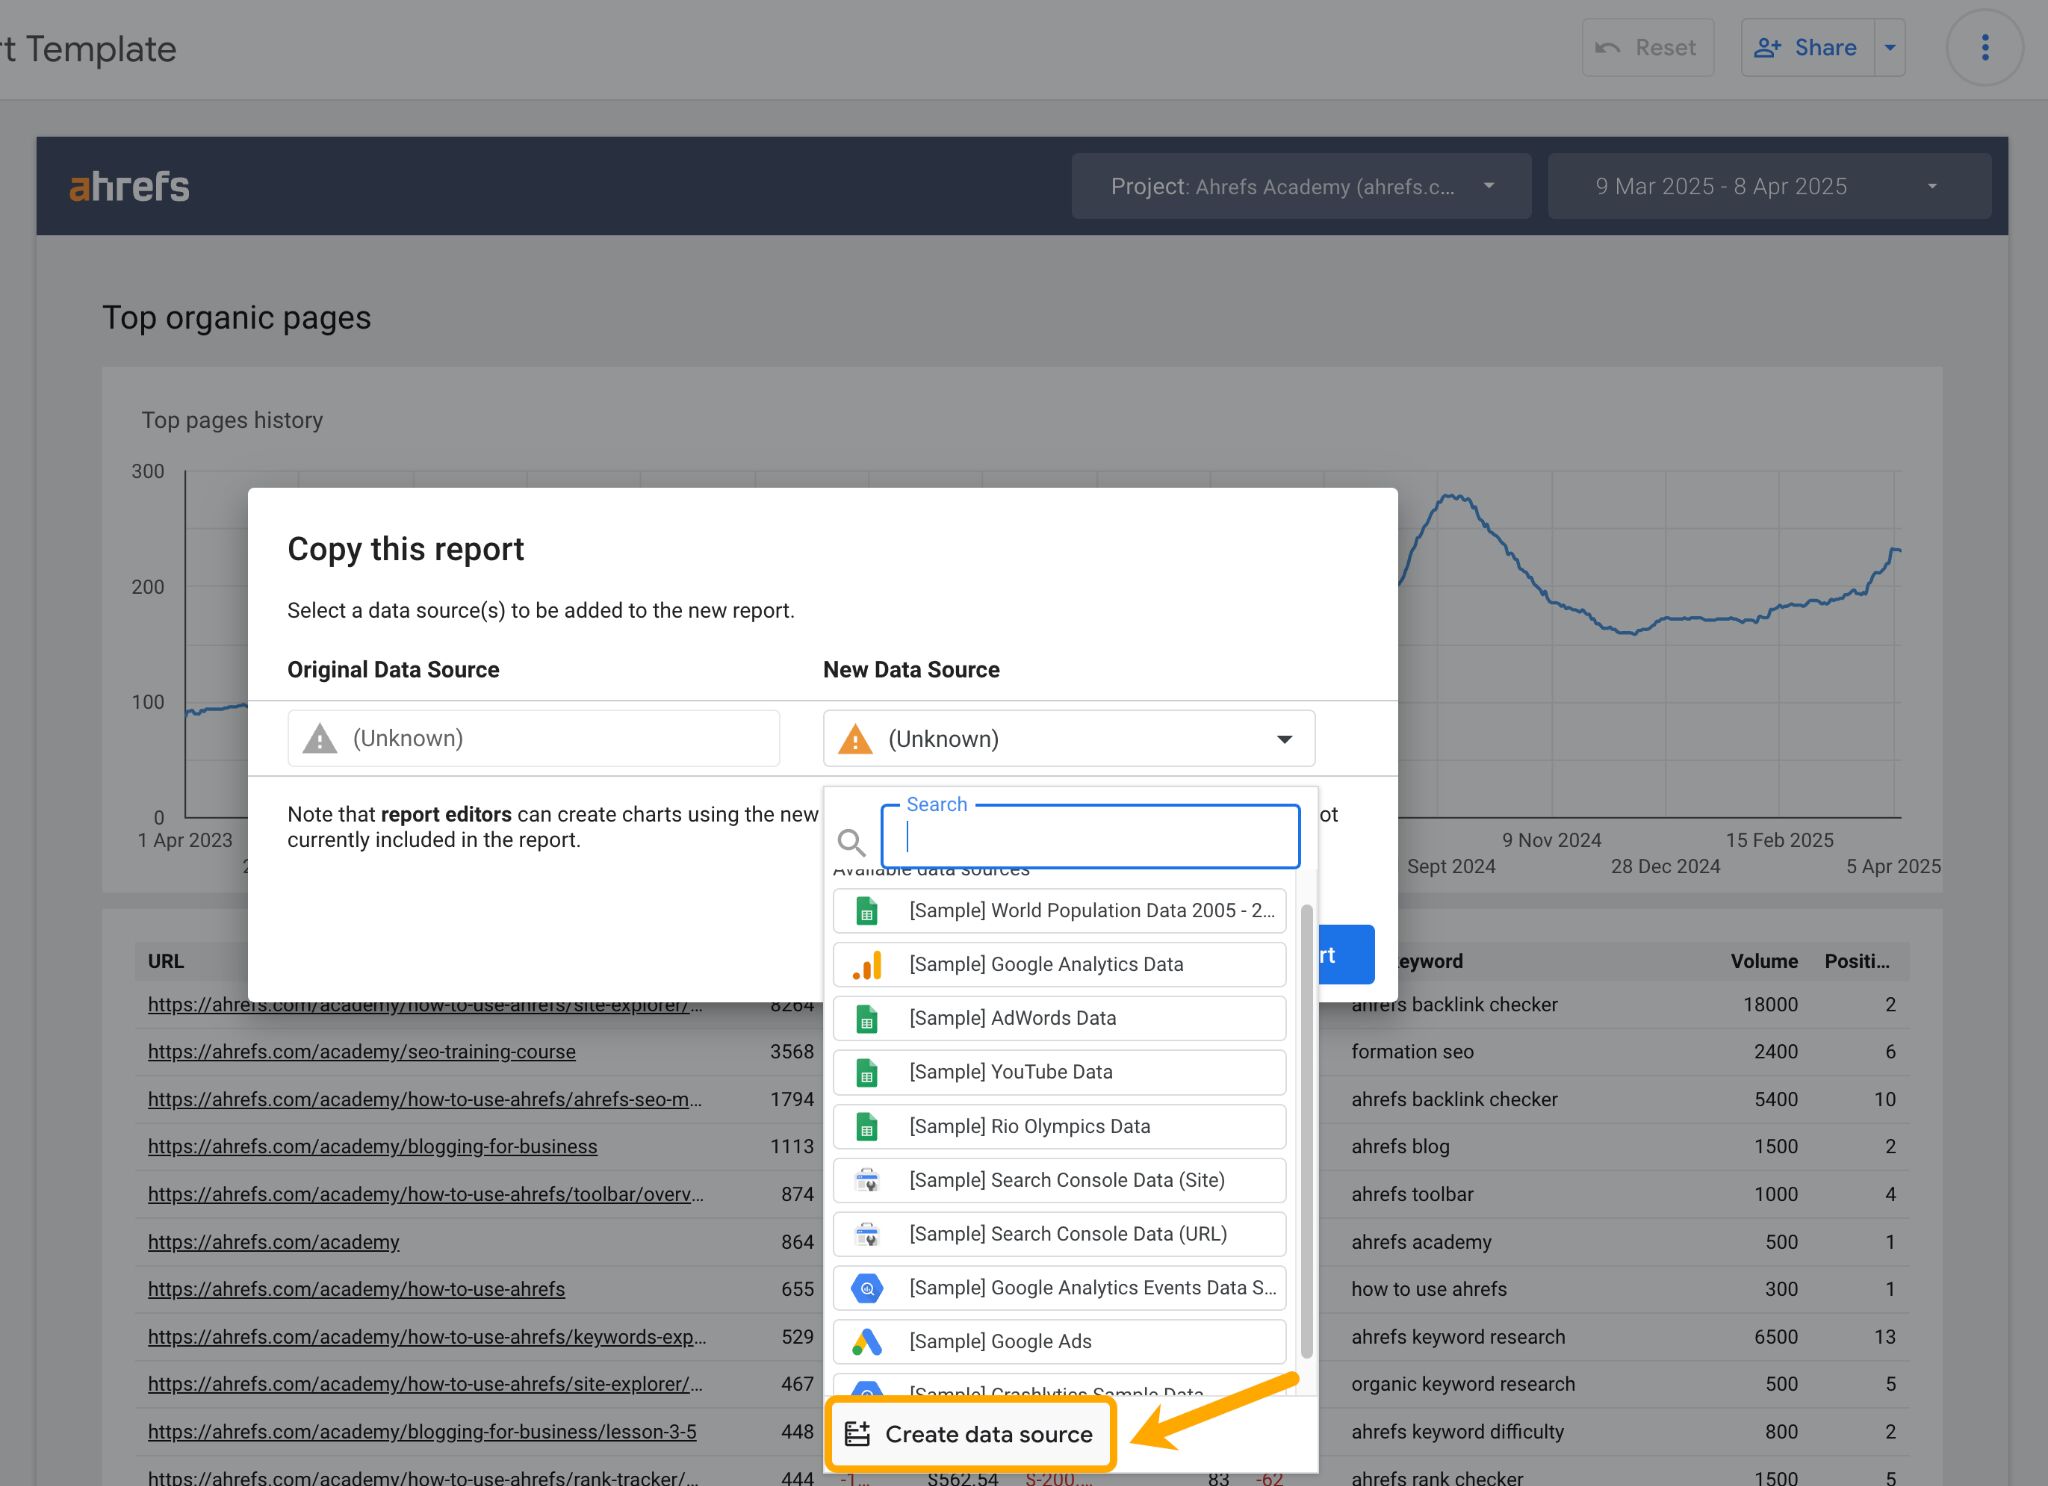
…and search for your chosen Ahrefs data connector.
Choose your project, and leave all other fields blank—you can adjust them later on in the actual report. 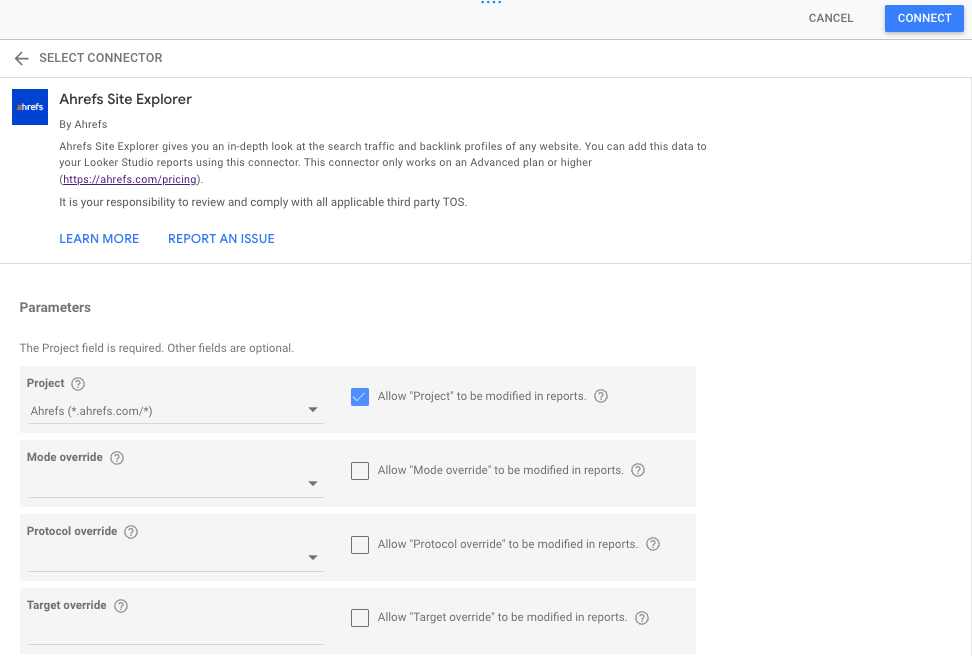
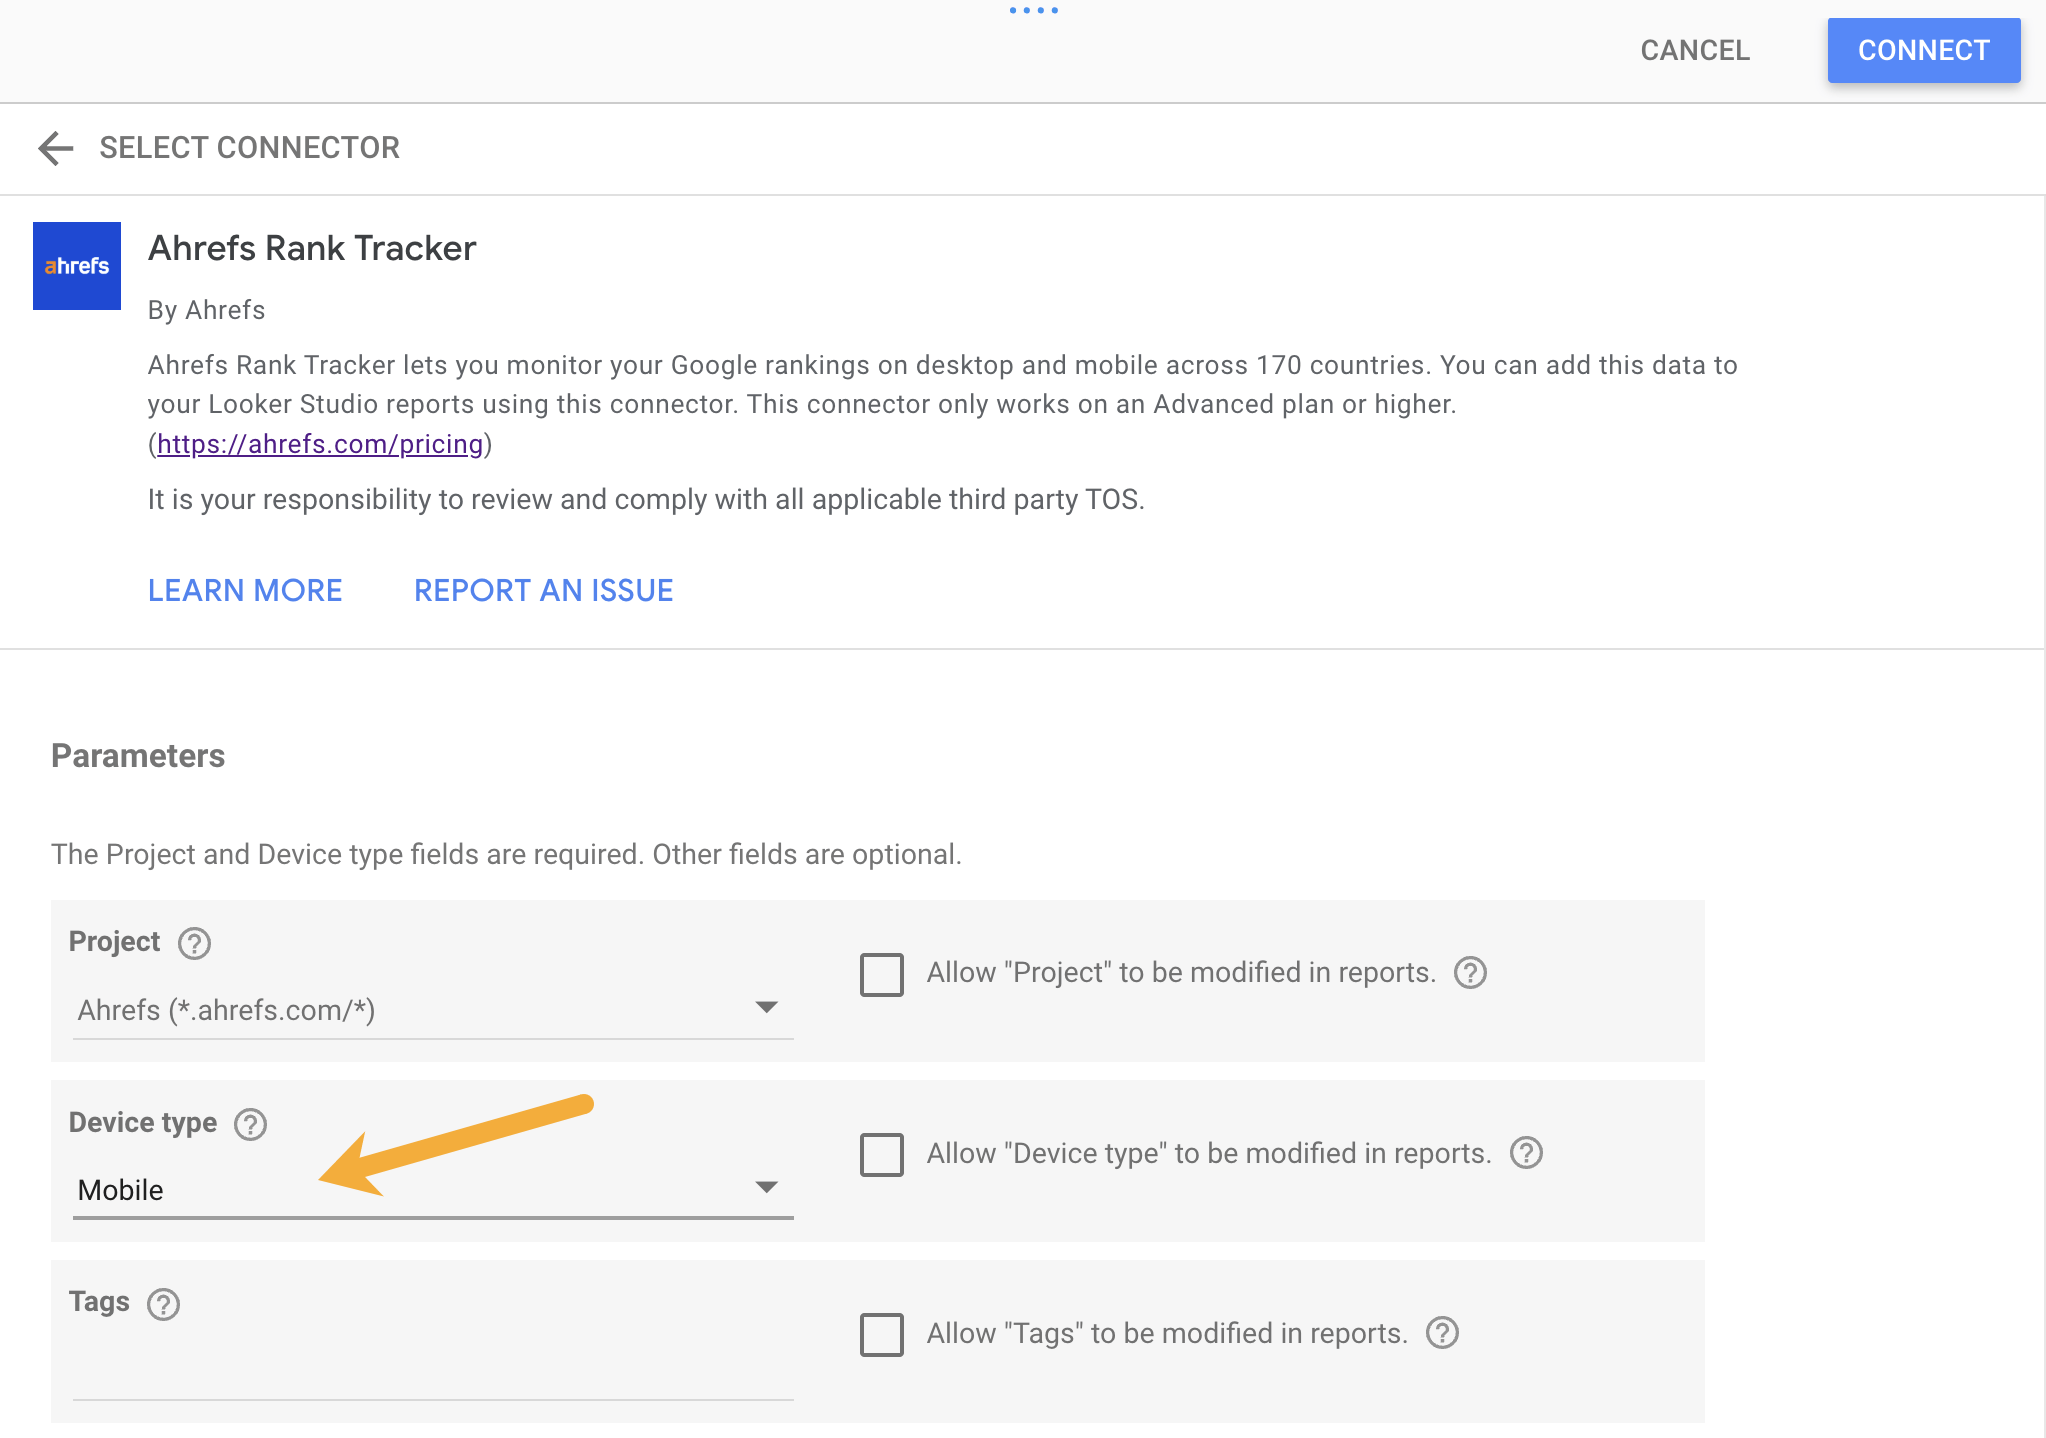
The exception to this rule is if you’re adding “Rank Tracker” as a data source. In this case, you’ll need to select a “Device type” before you can “Connect”.
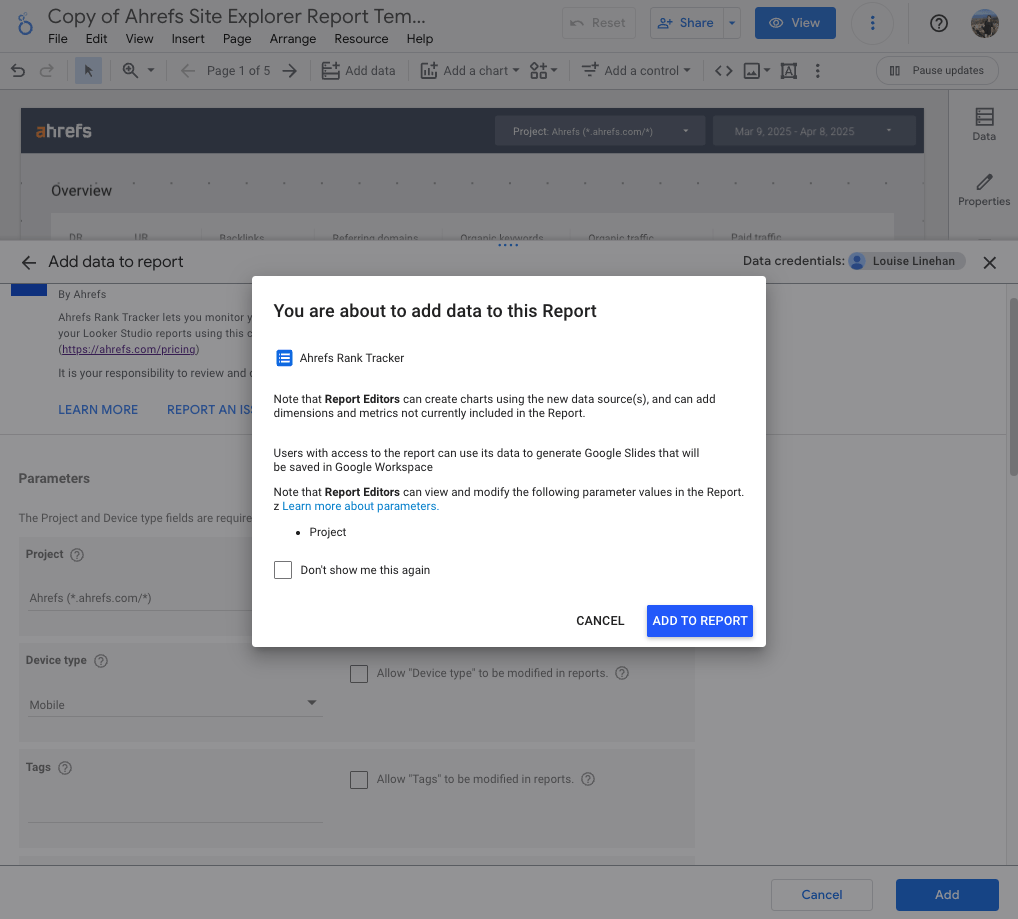
On the next screen, hit “Add to report”.
At this point, you can add other data connectors like Rank Tracker or Site Audit, so that you have more dimensions, metrics, and parameters to play with.
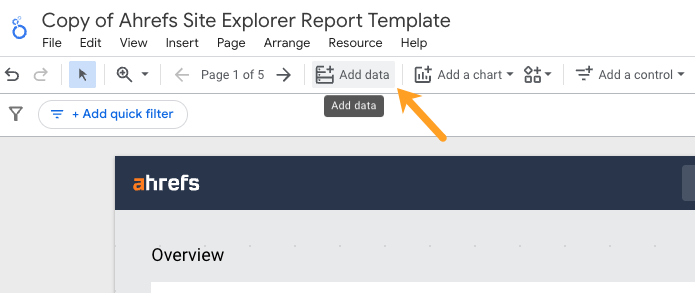
Click “Add data”, search for Ahrefs again, then select your connector, and repeat the configuration above.
If you want to isolate brand performance, you need to be able to filter all of your data.
But not all Ahrefs fields and charts can be segmented in this way (e.g. Organic traffic charts, Top pages history charts).
Tip
For that reason, every datapoint I included in my dashboard was chosen because it can be filtered.
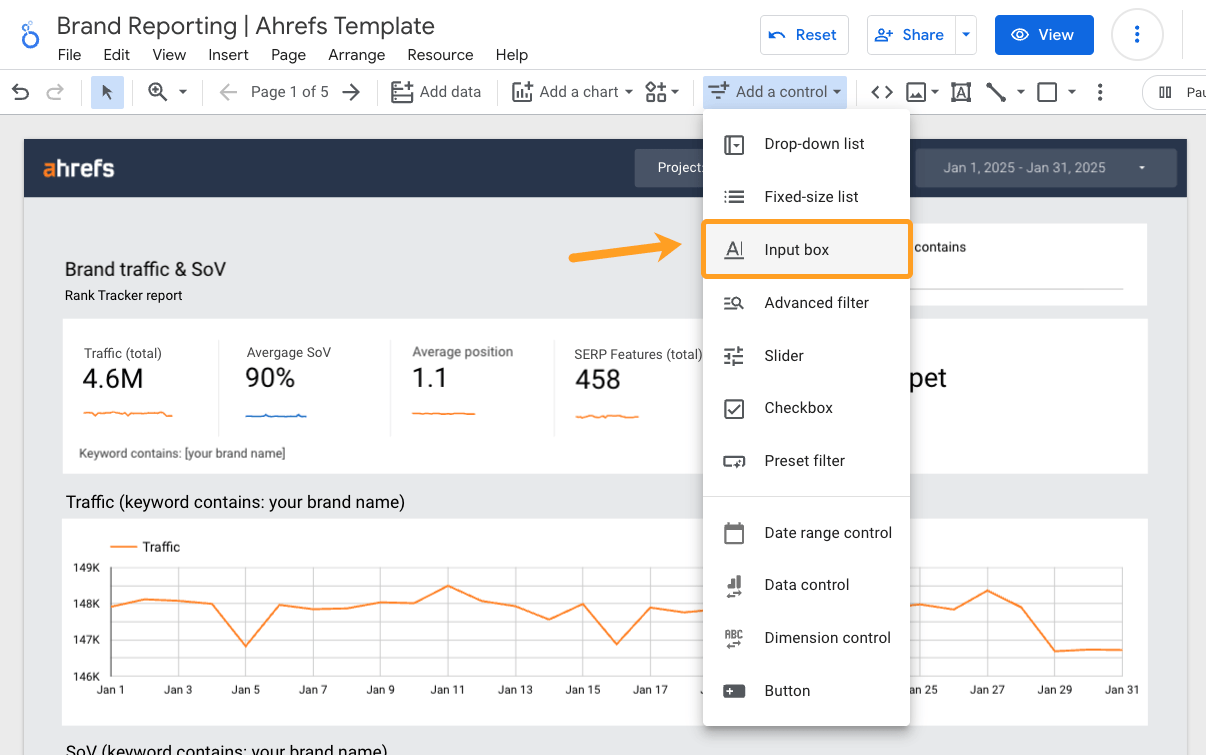
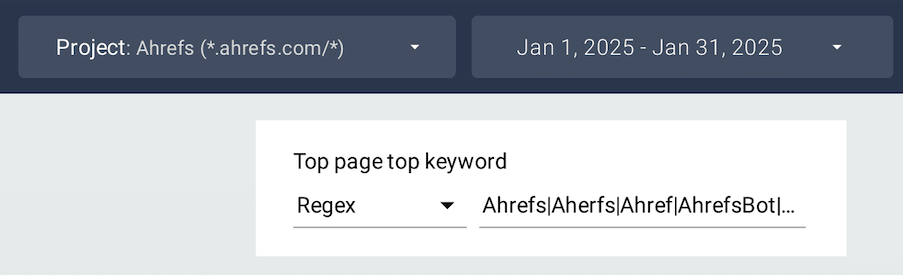
On each page, I segmented our overall performance, using regex and contains filters, using “input boxes” to limit analysis to our brand name and any variants/misspellings.
Tip
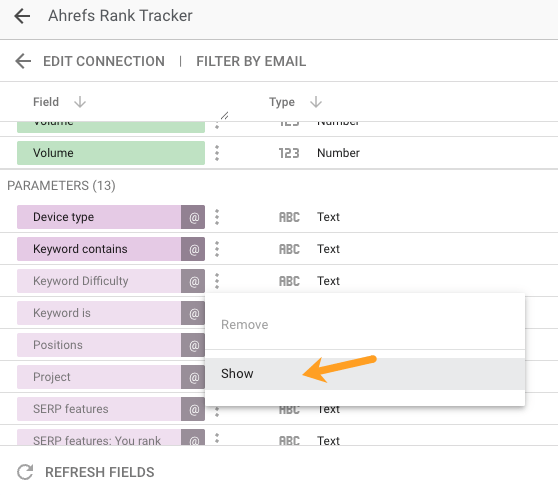
To apply these filters, make sure you have “Allowed” our pre-configured parameters. You can’t filter certain charts or data without these parameters. I’ve made this mistake a couple of times! To check, head to “Data Sources” on the right, and click the pencil icon.
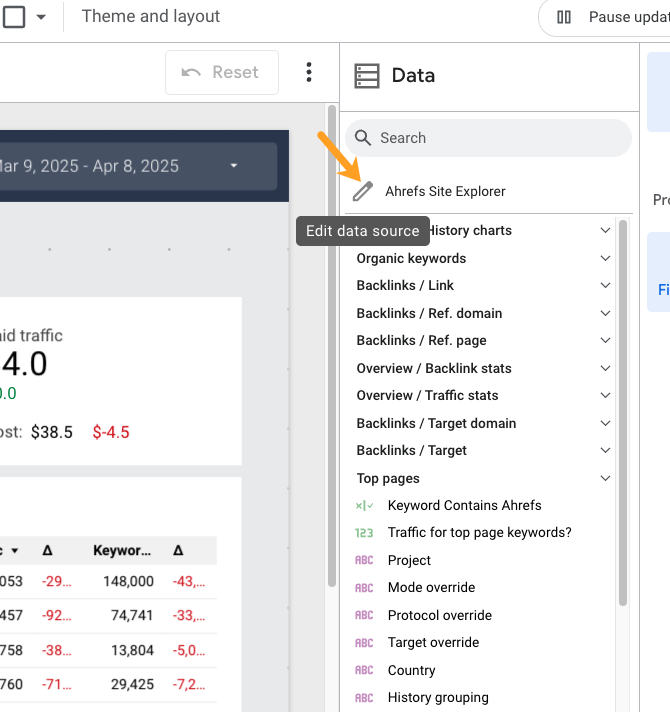
Then scroll down to “Parameters”. If any are greyed out, click on the three dots and select “Show”
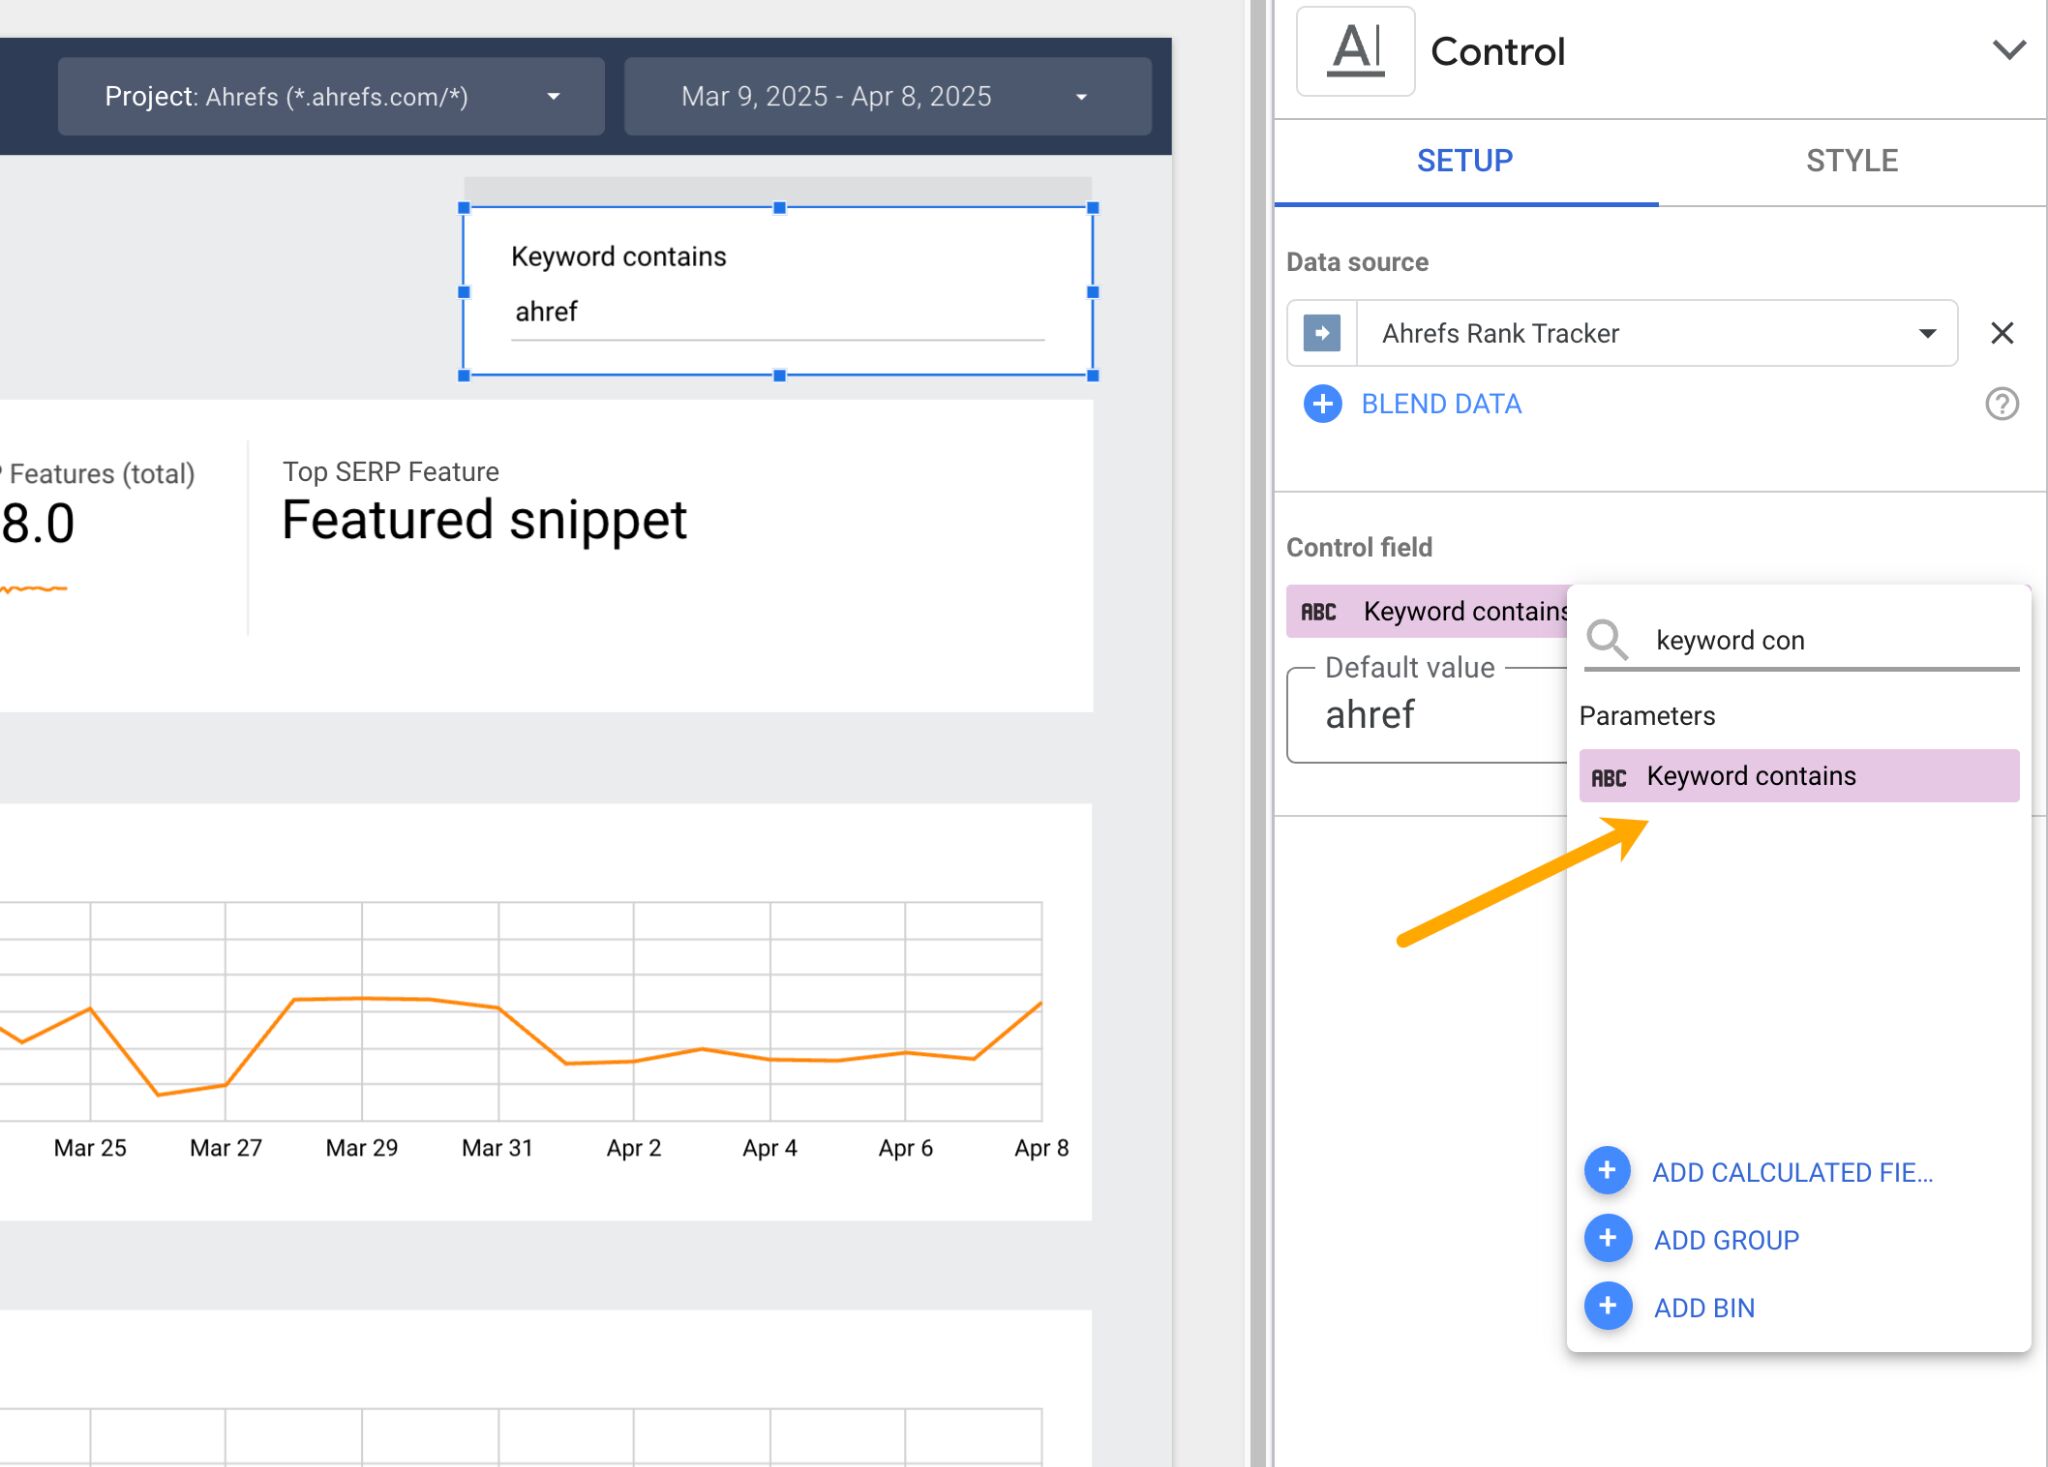
For example, I used the “Keyword contains” parameter to filter our Rank Tracker data by brand keyword.
Every dimension, metric, field, and visualization I added to the dashboard was very much trial and error.
I recommend playing around with the data in the same way, until you build what you need to see.
Using the Rank Tracker data source, you can monitor a bucket of your most valuable keywords.
Track an Ahrefs project that’s a mixture of brand and non-brand terms, then use “Tags” or filters to focus just on brand terms.
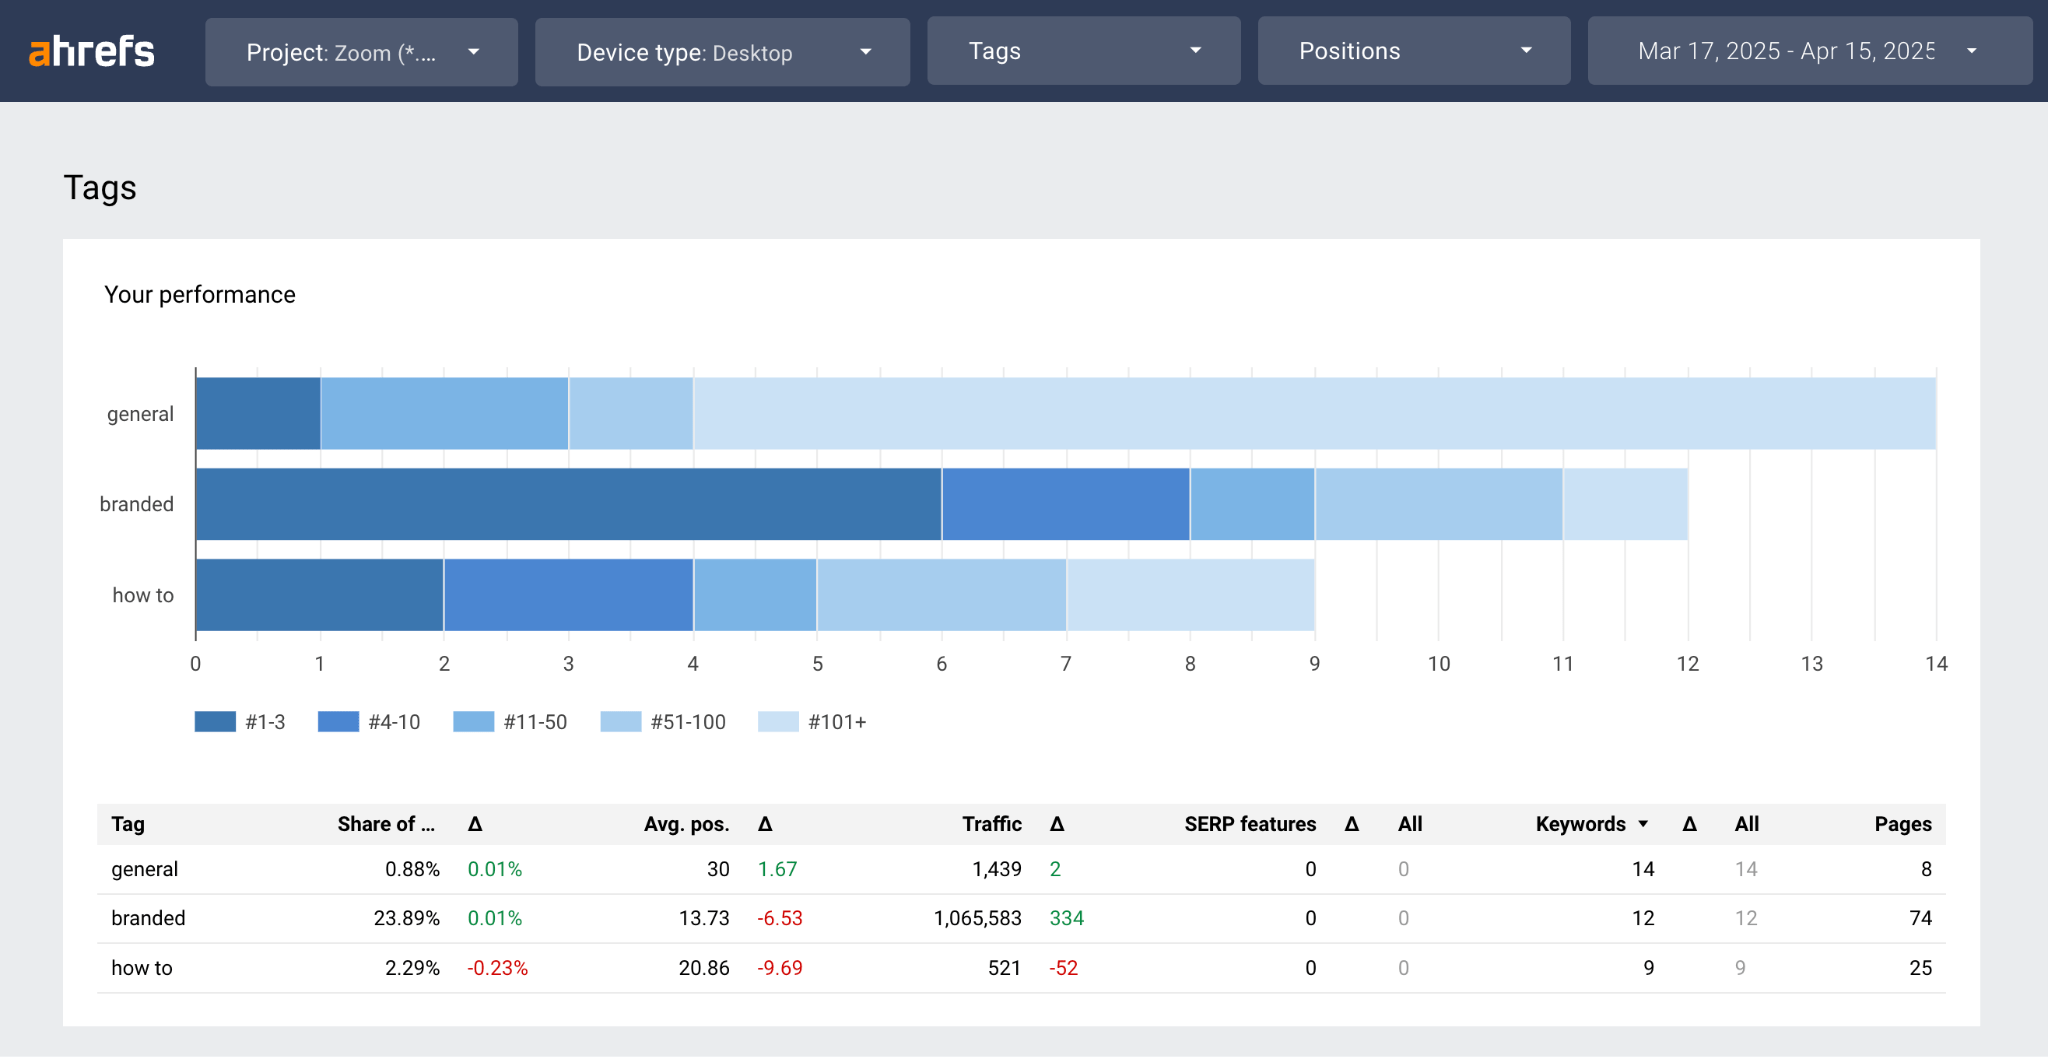
Or, set up a new project tracking only your brand keywords.
Once you’re looking at brand terms, select the “scorecard with compact numbers” view, to see high-level metrics at the top of your report.
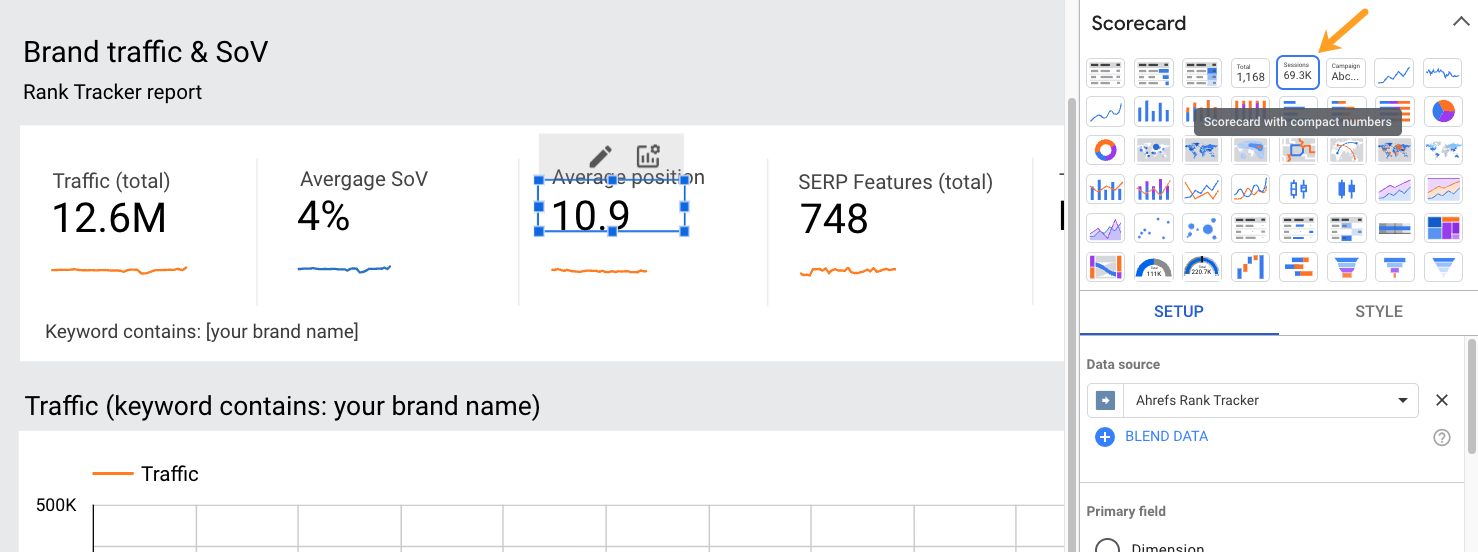
When you’re configuring these “scorecard” numbers, make sure you use our competitors history fields.
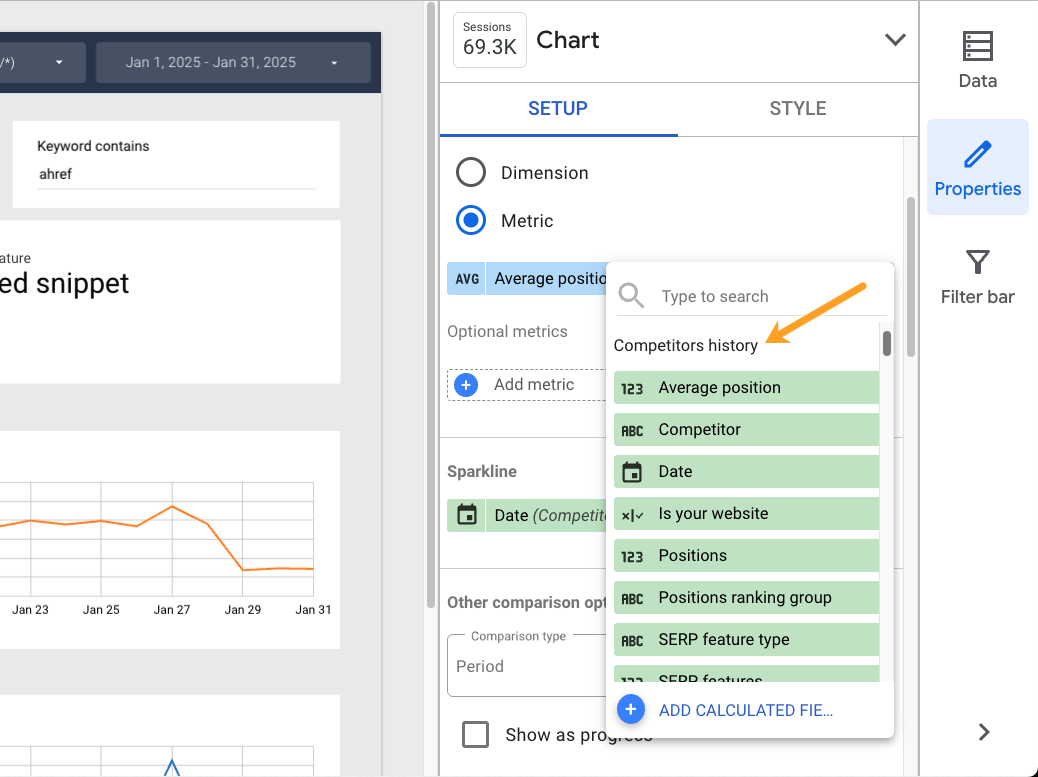
This way you can quickly spot-check your brand positions, SERP features, share of voice, and traffic, and monitor any growth or decline with “sparkline” visuals.
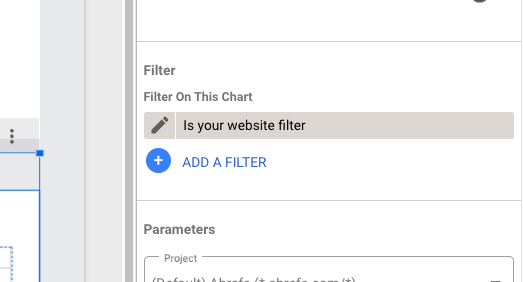
Finally, set up an “Is your website filter” to monitor only your site, and sift out any competitors you track in your project.
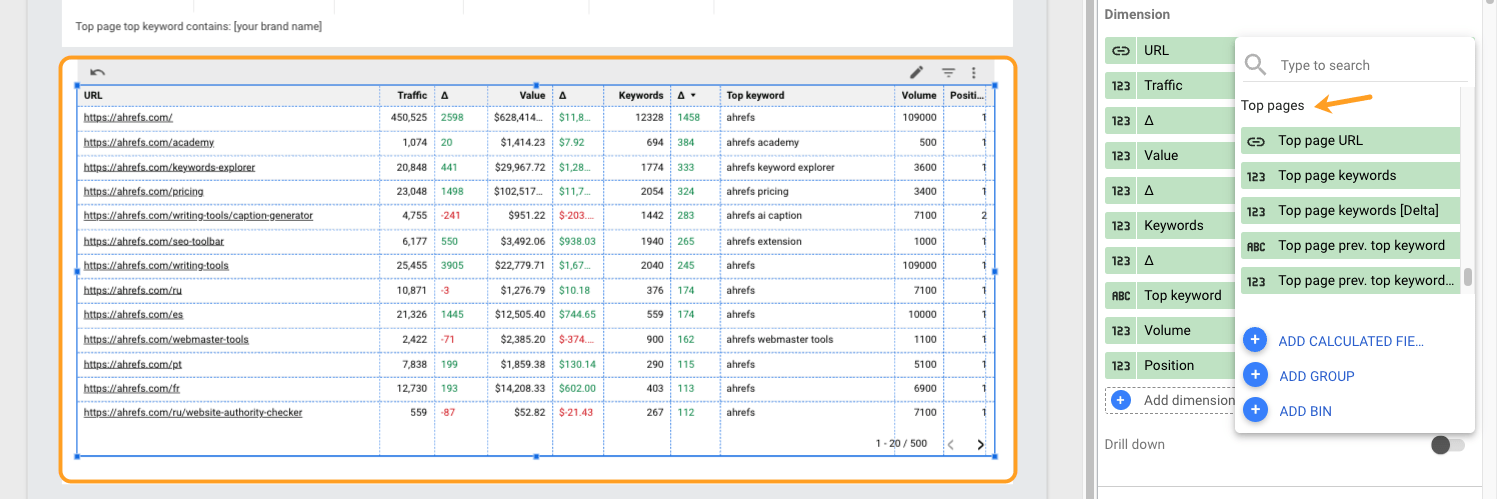
Now that you’ve tracked your self-selected brand keywords, monitor the ones driving traffic to your top pages.
You can plug into our “Top pages” data via the Site Explorer template.
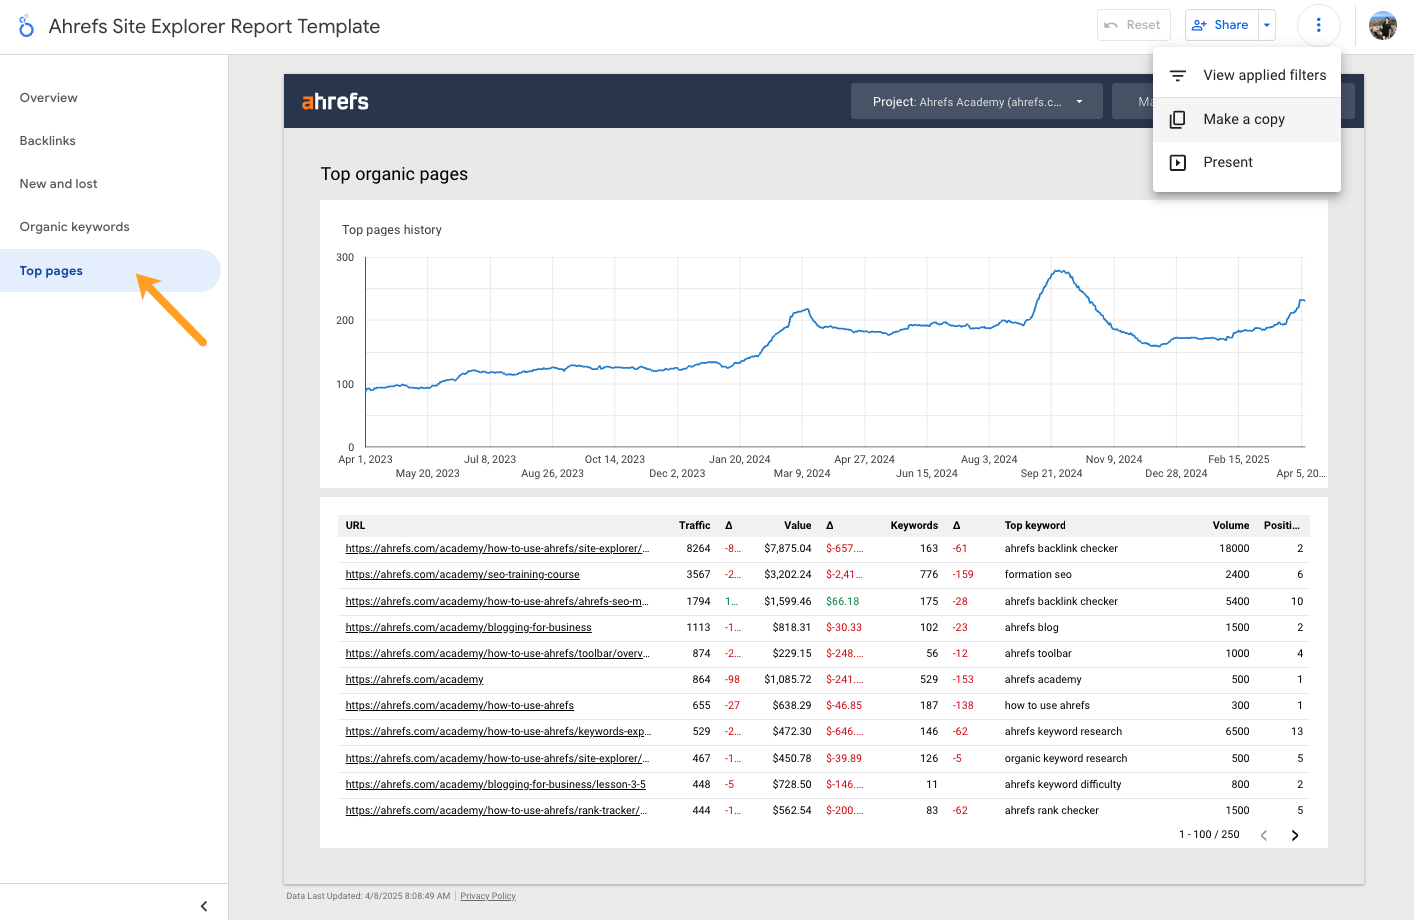
Just as you did for Rank Tracker, add scorecard stats and deltas at the top of the report to understand your overall, month-over-month performance.
Treat these metrics as a starting point, then see what’s driving brand performance at the page level.
To do so, set up table data below using a series of dimensions determined by “Top page” fields.
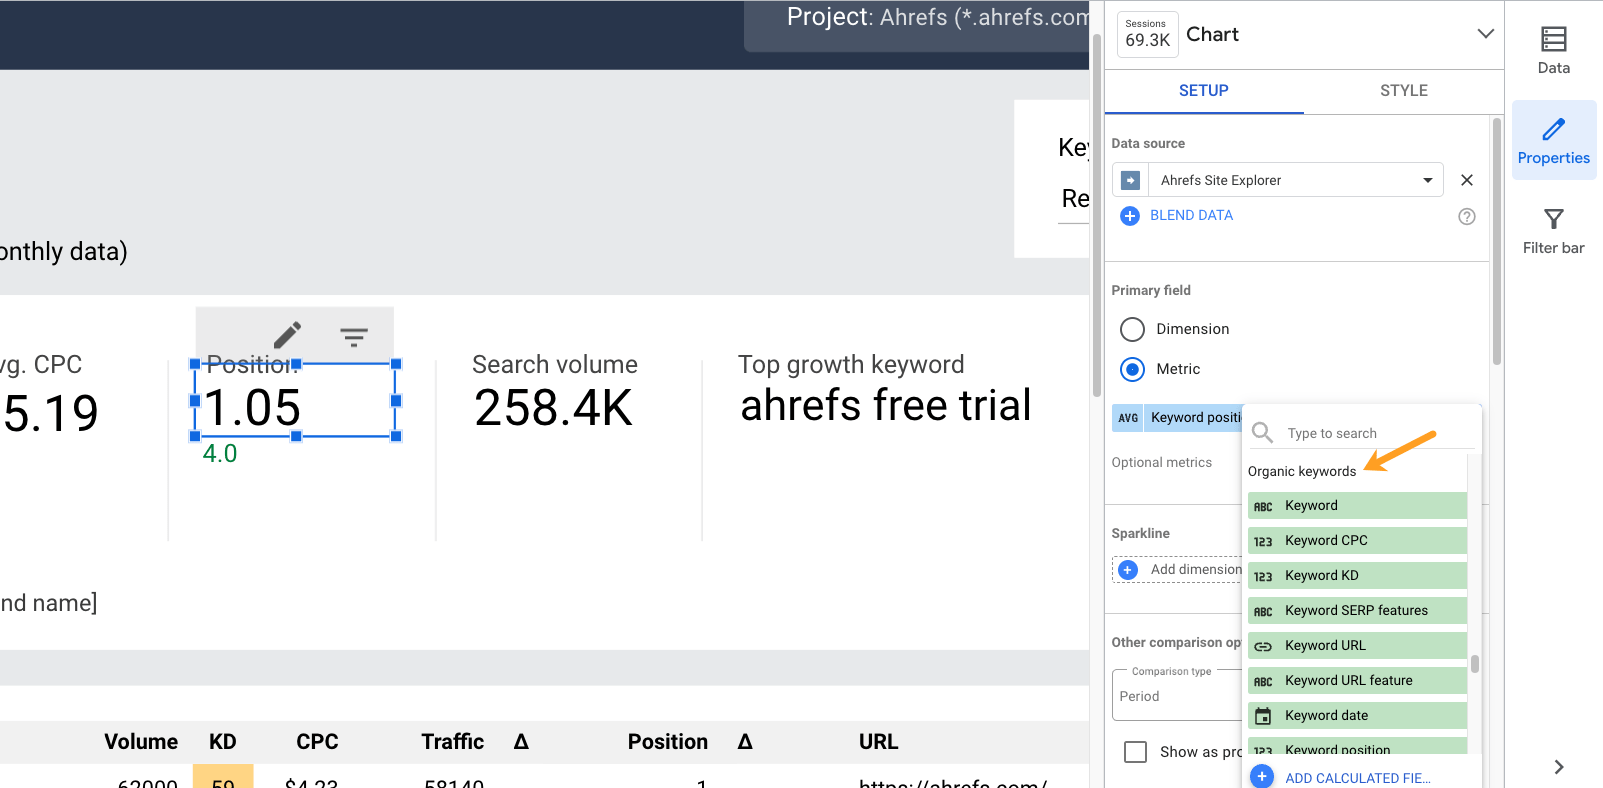
You’ve tracked a custom set of brand keywords, your top page brand keywords—now assess all of your brand keywords.
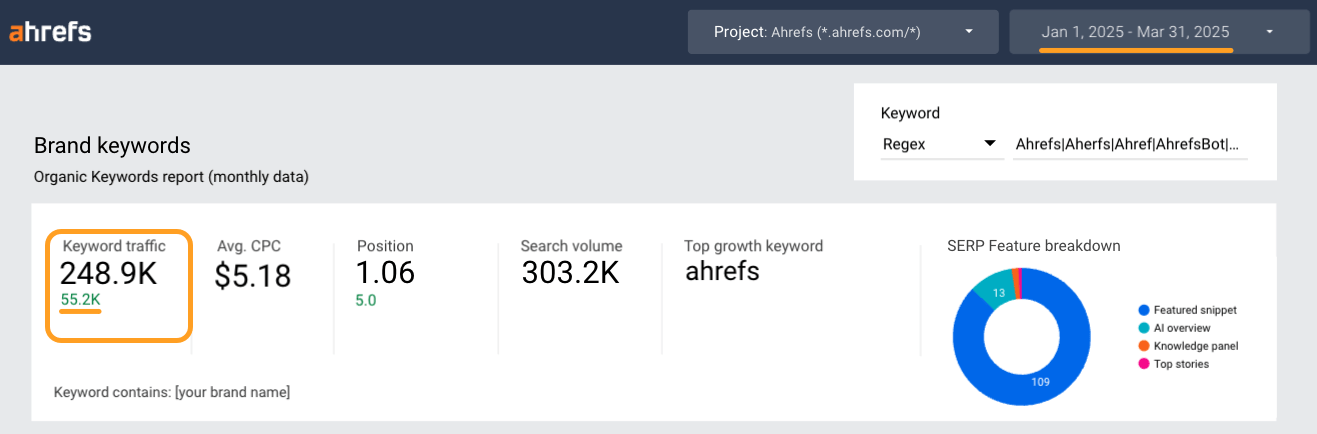
Pull in data from the Organic Keywords report. This lets you see all of the keywords your brand is showing up for (not just the ones you manually track)—great for spotting breakout terms.
Set up quick-glance stats of traffic, CPCs, positions, and search volume data, using “Organic keywords” fields as your metrics.
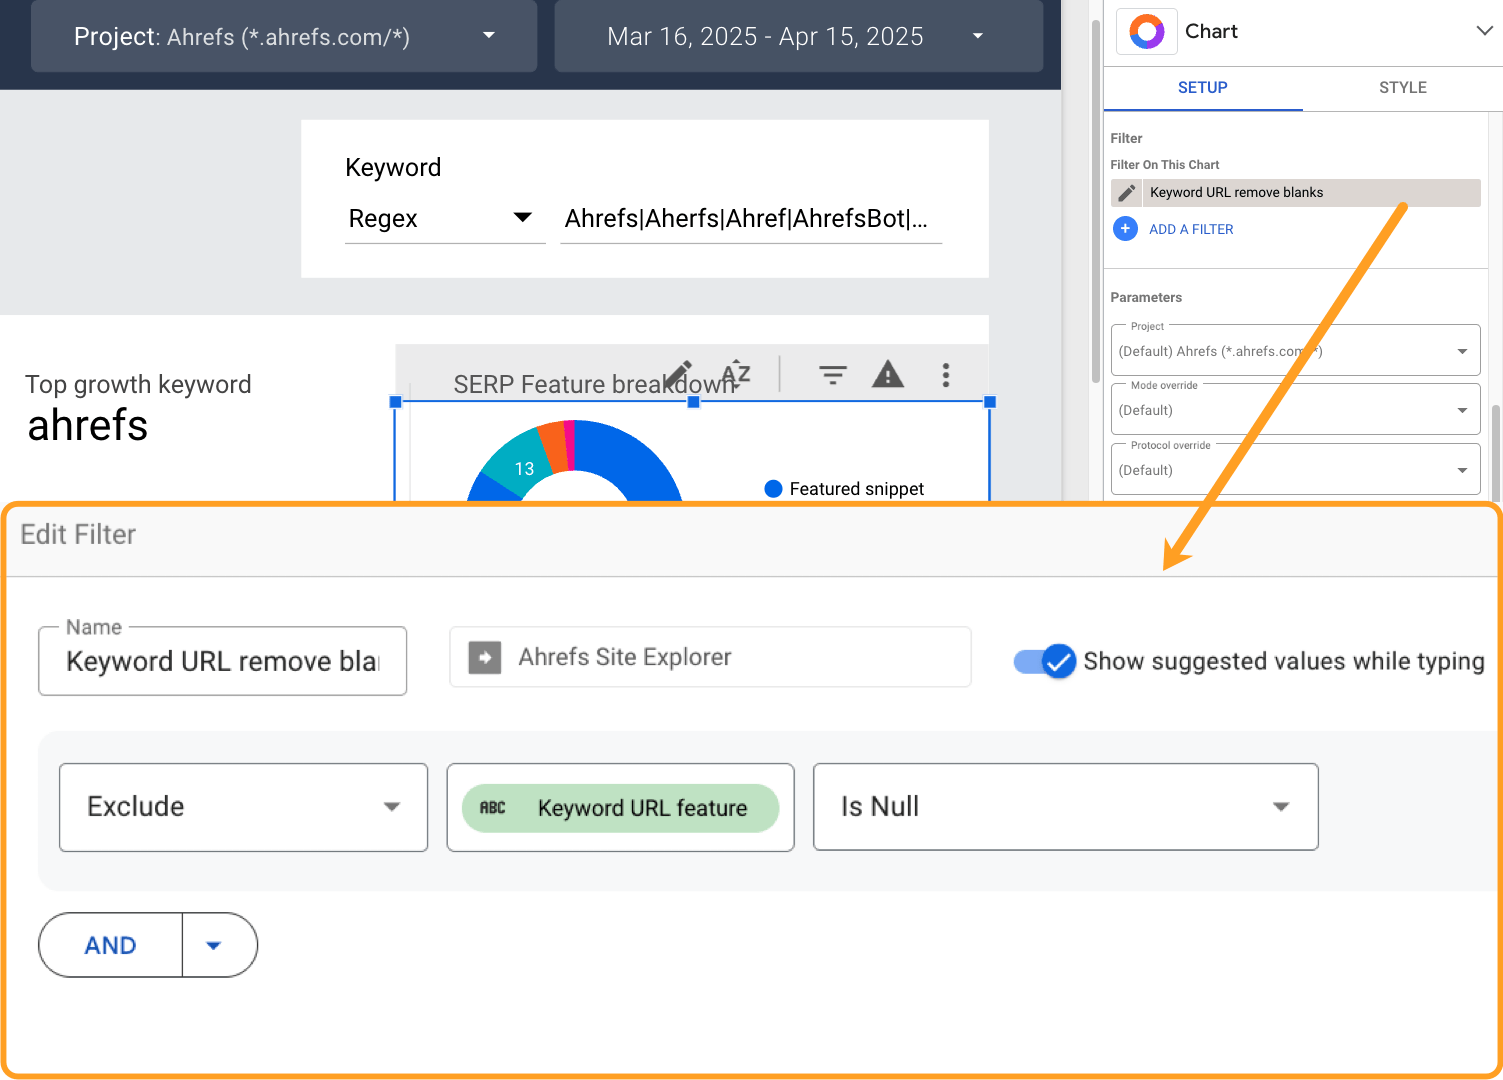
Then create a pie chart to visualize your SERP Feature ownership.
1. Add “Keyword URL feature” as the dimension
2. Add “Keyword” as the metric
3. Add “Keyword” as the sort feature (by descending)
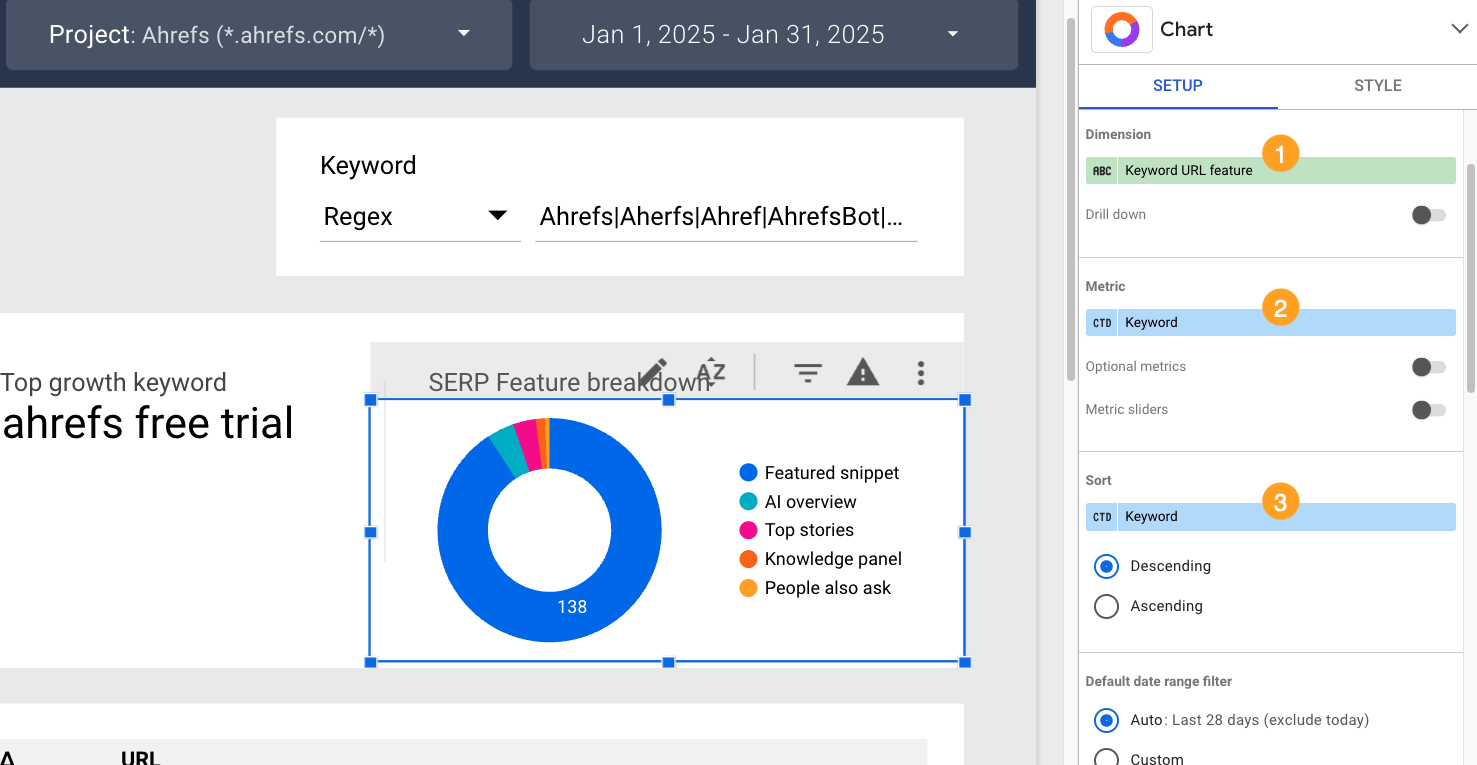
4. Add a filter “Keyword URL remove blanks” (Exclude → Keyword URL feature → Is Null)
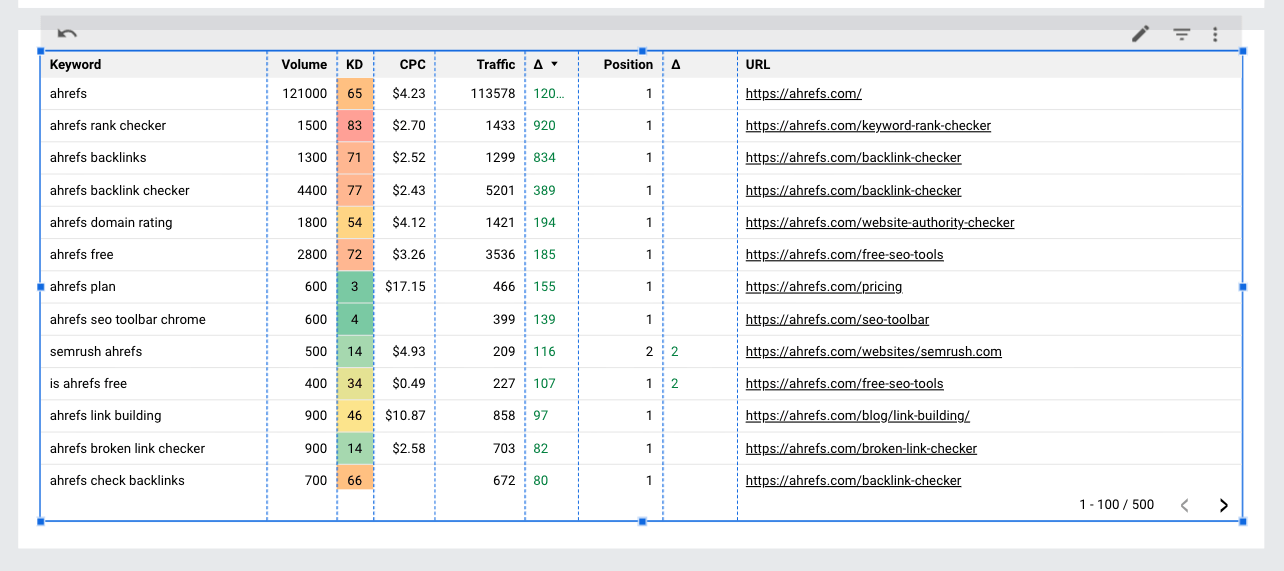
Then build a simple table of keyword performance data, including metrics like volume, keyword difficulty (KD), positions, traffic, and traffic growth, so you can see the data behind performance peaks and troughs.
The way third parties reference your brand matters more than ever, if you want to stand out in AI and search.
Track how third-party sites are referencing your brand using Site Explorer’s Backlinks report.
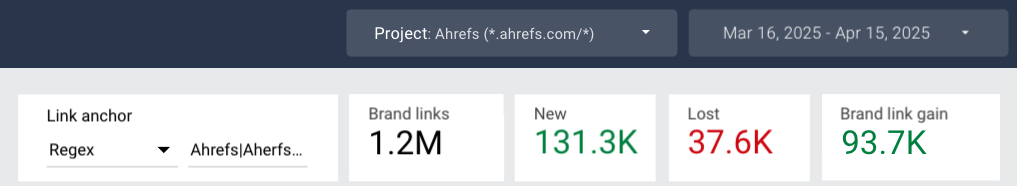
Start with big-picture metrics:
- Total brand links
- New vs. lost branded links
- Net gain over time (New brand links – Lost brand links)
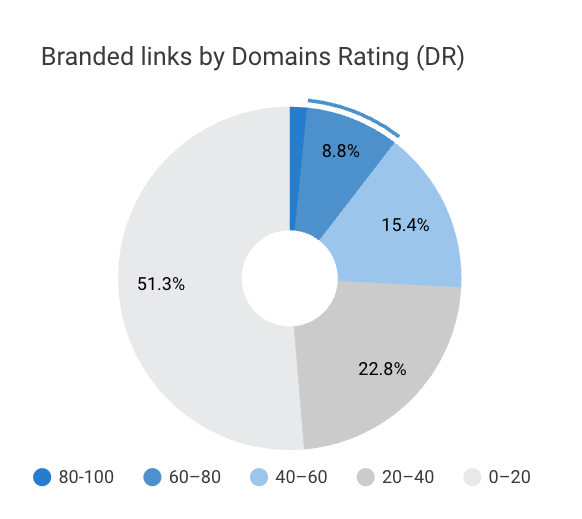
Then visualize the quality of these links. Set up pie charts of your branded links broken down by domain rating (DR).
Tip
Note down your percentage of DR > 60+ branded backlinks each month—this is a good way to assess the growth of high-authority links.
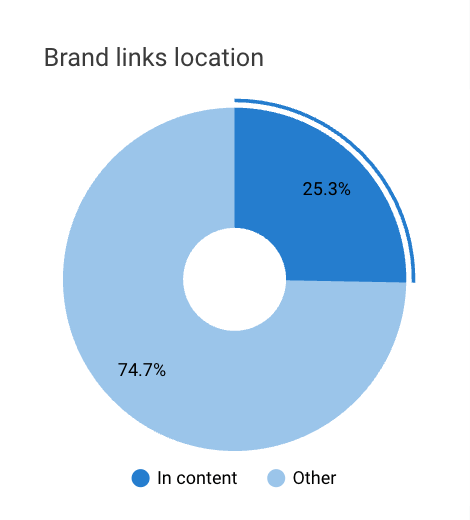
You can also track your in-content links so you’re not focusing on non-relevant html or image links.
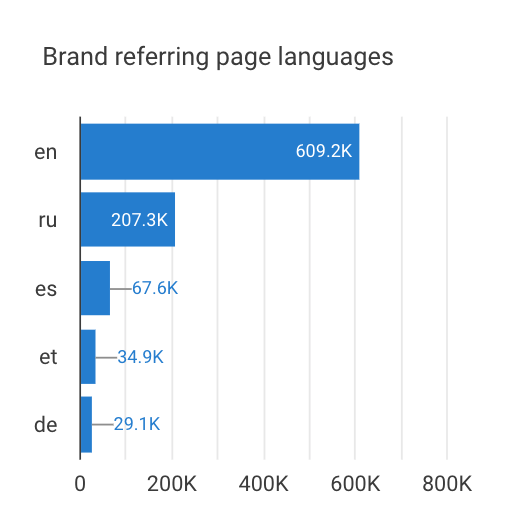
And monitor link languages, to infer how many brand references are coming from your target regions.
Then, check performance on a link-by-link basis, by adding in table-detail below, including:
- Brand referring domains
- Brand anchors
- Individual brand backlinks
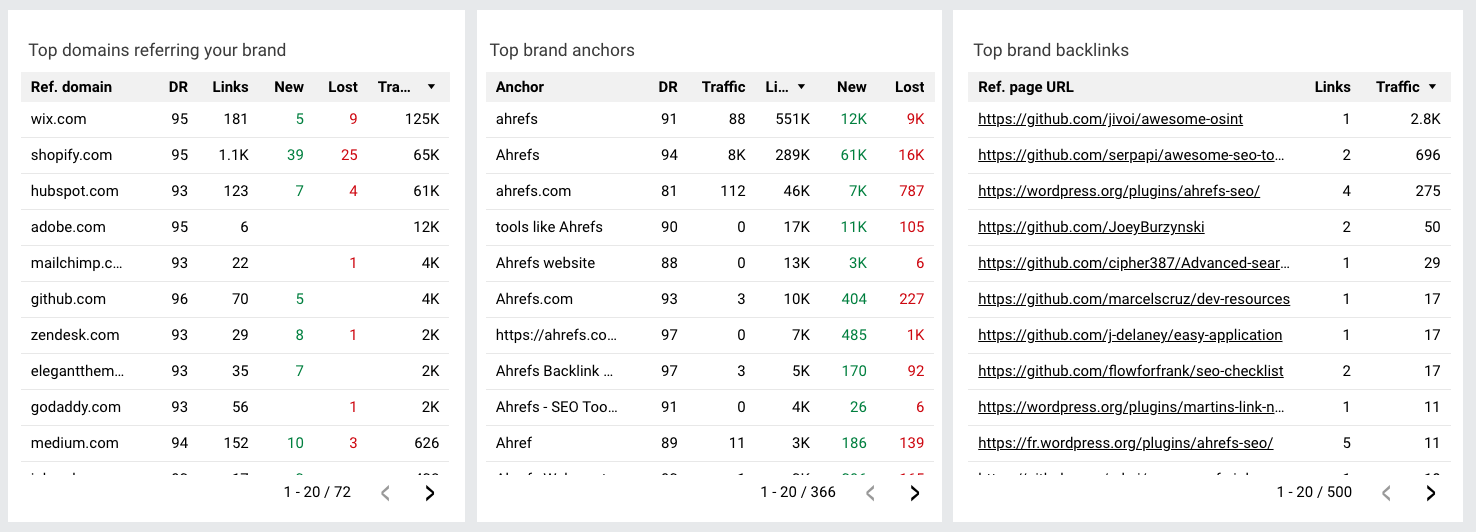
Finally, sort these tables by traffic to get a quick idea of where your most organically visible brand links are coming from.
Once your dashboard’s up and running, there are a few practical ways to start putting the data to use.
A good first step is to report on your brand performance over the last year and use those stats as your benchmark metrics.
From there, track performance each month—comparing against your benchmarks and noting any growth or decline. If anything interesting jumps out, share it with your team.
Beyond that, here are five more ways you can use this data:
1. Benchmark brand performance
Compare your brand traffic, links, and SERP visibility against total performance, to see how much of your organic success comes from branded activity.
Just use those “keyword contains” and “regex” filters to track brand performance, then leave them blank to gauge total performance.
For example, we found that our branded link gain in Q1 this year was 160% higher than our total link gain.
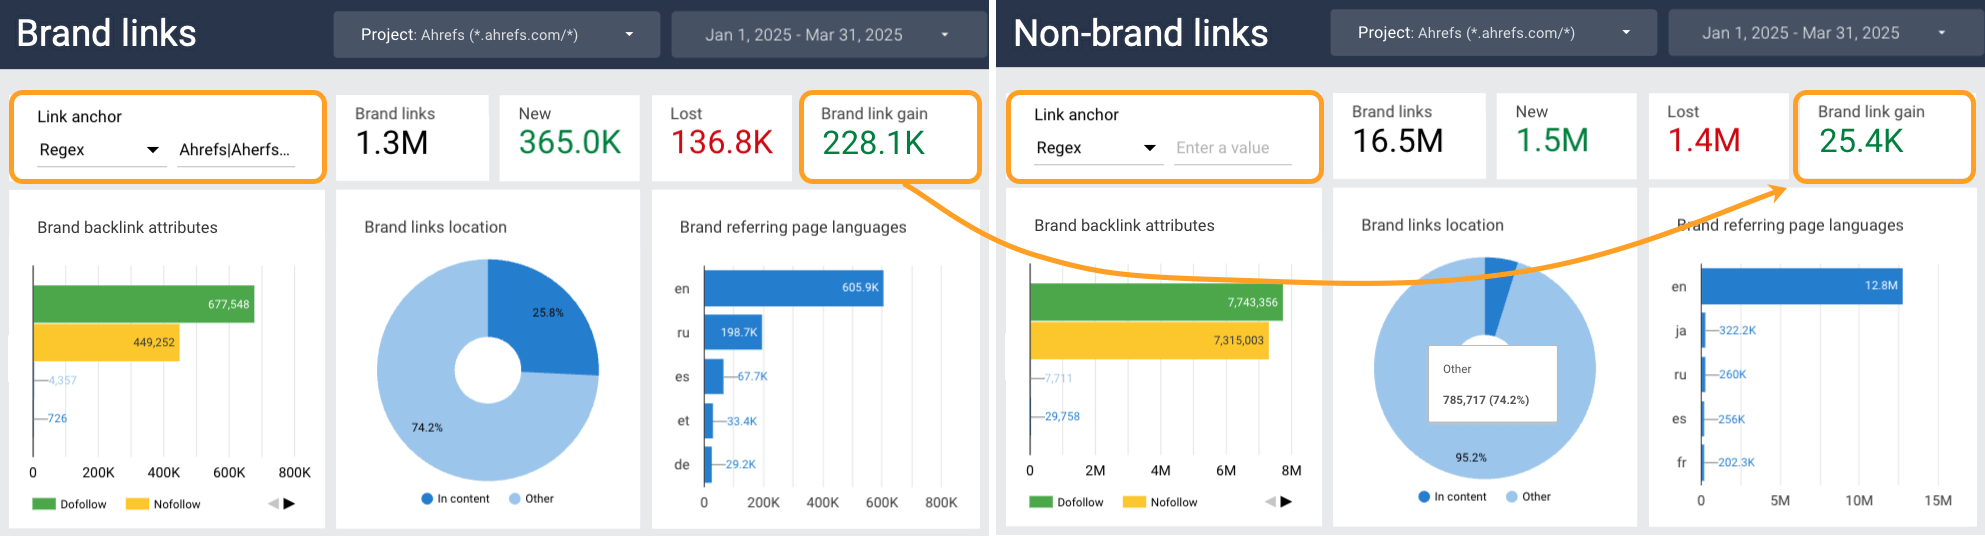
This insight tells us that the Ahrefs brand has attracted more than double the amount of links this year, compared to our overall average.
2. Monitor brand trends over time
Track how your brand presence evolves month-to-month.
For example, from our LS dashboard, I noticed that our brand keyword traffic has grown by 28% this quarter.
If you revisit data regularly, you can look for patterns and correlations, like whether a rise in high authority links correlates with traffic spikes.
This data can be a case for more brand investment—or a warning when metrics dip.
Tip
Feed a PDF of your monthly Looker Studio reports to ChatGPT and ask for help identifying any trends or correlations.
3. Track brand positioning shifts
If you’re repositioning your brand (at Ahrefs, for instance, we’re moving towards becoming a “market intelligence” tool), watch how keyword and content performance changes.
Tracking growth keywords can show you if your brand messaging is headed in the right direction—or if there’s a mismatch between how you want to be seen and how your audience actually sees you.
Your “Top pages” and “Branded backlinks & anchors” reports can give you a better idea of how strongly users connect your brand with certain topics.
4. Measure campaign impact
Use the dashboard to see if brand campaigns, PR, or partnerships are moving the needle.
After we revamped the Ahrefs Academy last month, we can see related Academy pages have been some of our top traffic drivers this month.
5. Test brand content optimizations
If you’re experimenting with including your brand name more frequently alongside relevant phrases, ideas, and features—like in titles, meta descriptions, or on-page copy—you can use the dashboard to see whether it’s improving your branded keyword performance.
Wrapping up
We’re living in a brand-first era. Brand is increasingly a top funnel and bottom funnel play—it drives both discovery and conversions.
Without brand awareness, you will be invisible in search, LLMs, and buyer discussions.
You can’t optimize what you don’t measure. With AI reshaping the landscape, it’s critical to monitor your brand presence now.
Have a go at creating your own brand awareness report with Ahrefs Looker Studio template, and let me know how you get on.