

Digital marketing analytics helps you understand which of your marketing tactics work and which don’t. The more you know about the effects of your efforts, the better you can allocate your time and budget.
Basic digital marketing analytics is easier than it sounds and provides enough information to evaluate your performance, create reports, and plan your strategy. What’s more, you can do it with free tools, and the process becomes even simpler when using my AI chatbot called DataDecode.
This bot is ideal for beginner marketers and business owners doing marketing on their own. Honestly, this is something I wish I had when I started marketing over a decade ago. Let’s dive in!
The DataDecode bot will help you:
- Identify trends and anomalies in your metrics.
- Forecast future performance based on past data.
- Give you an overall assessment of your strategy and suggest what to fix.
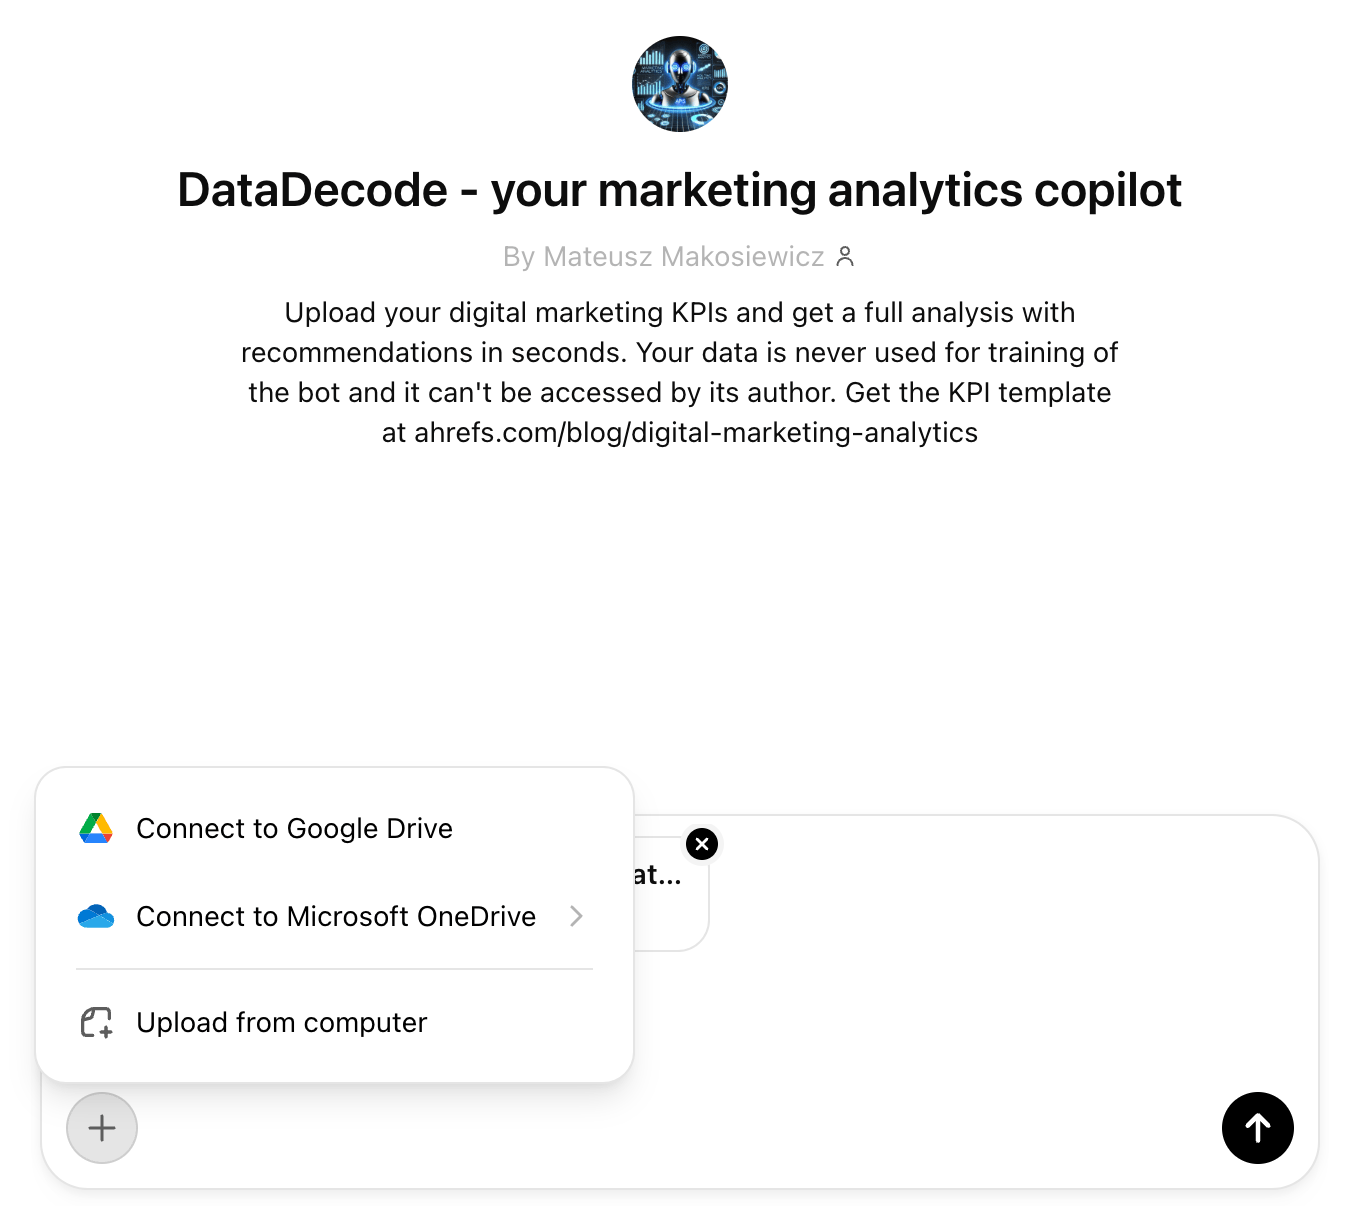
By the way, your data is safe. OpenAI does not store conversation data permanently or use it to train future models, and I won’t have access to any of the conversations.
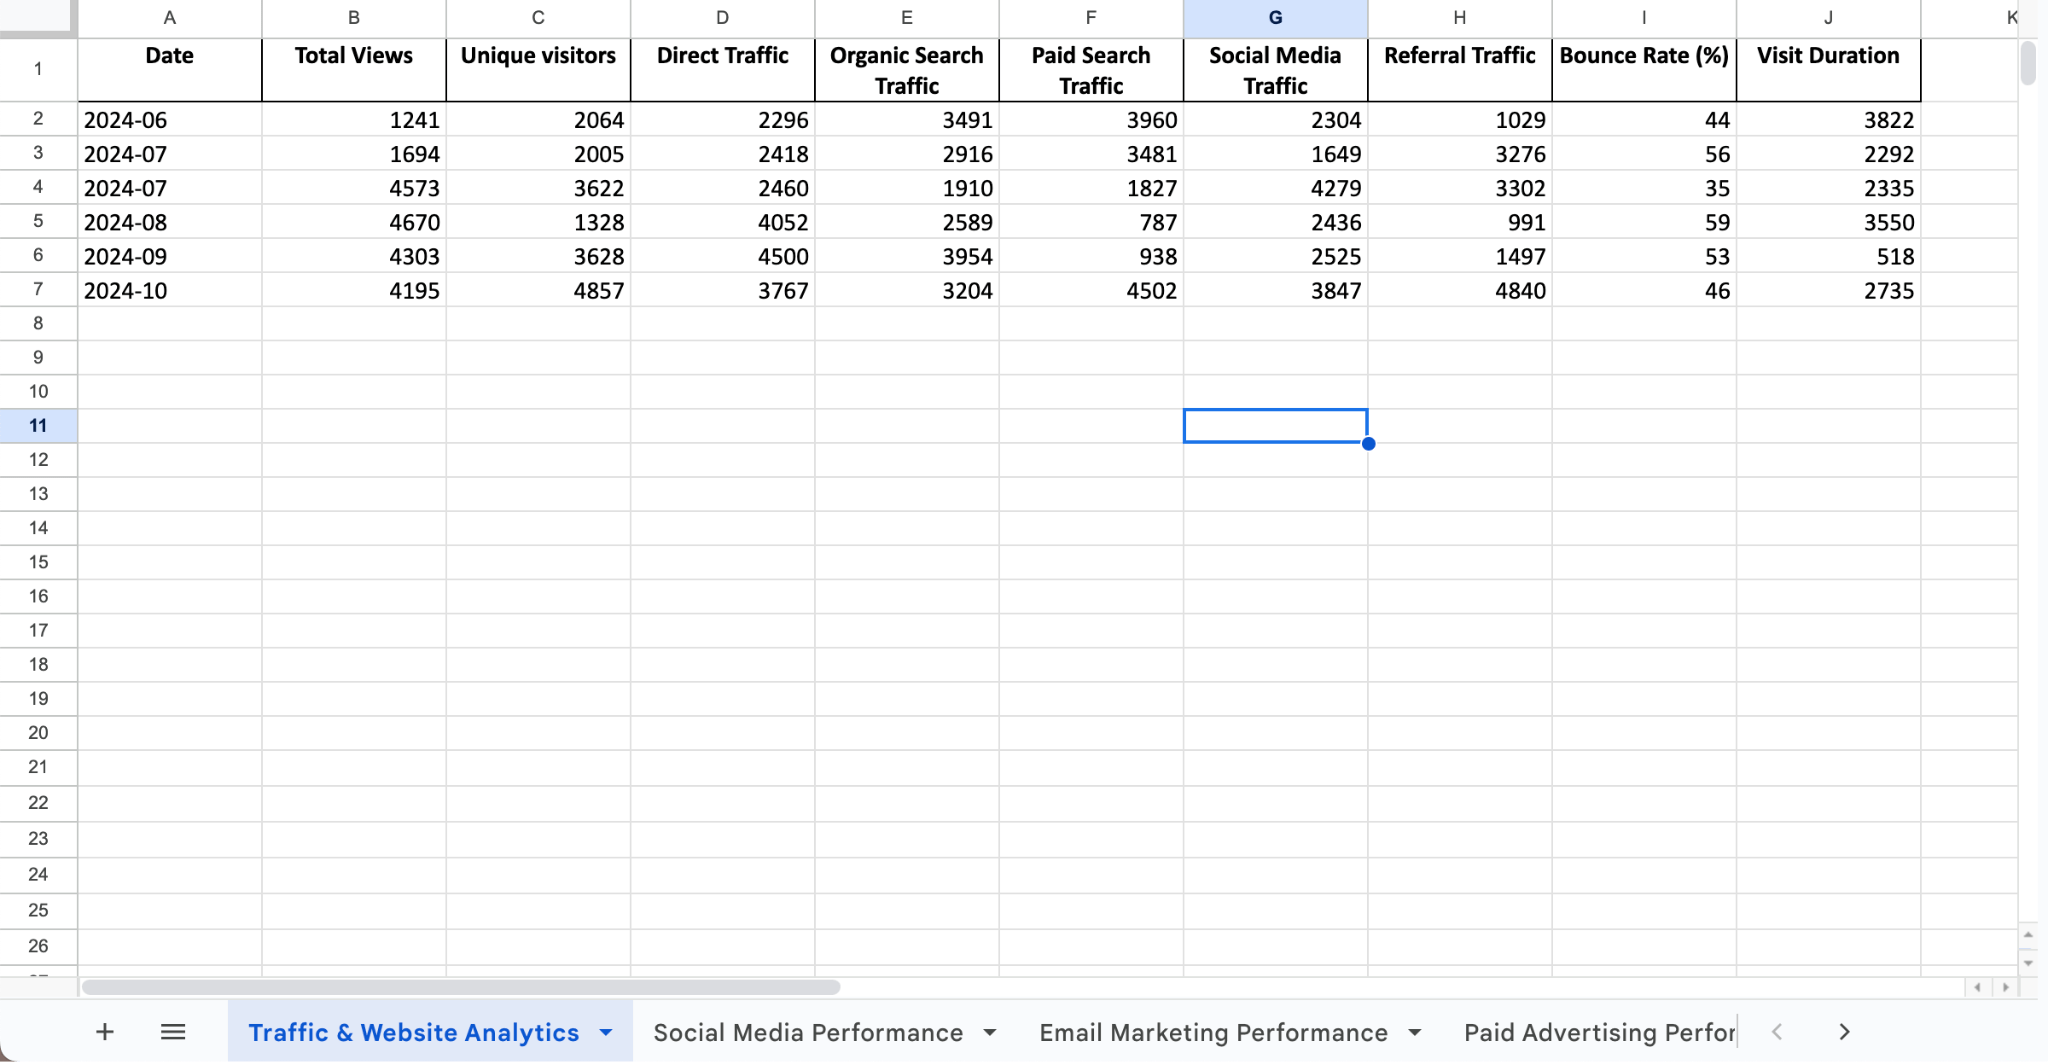
The bot uses a Google Docs template with a set of easy-to-follow essential KPIs you can fill in using free tools (I’ll cover these tools and metrics in a bit).
Click here to copy the template or get the xlsx file for tools like Excel and Numbers.
To give you an idea of how the bot works, here’s an example analysis.
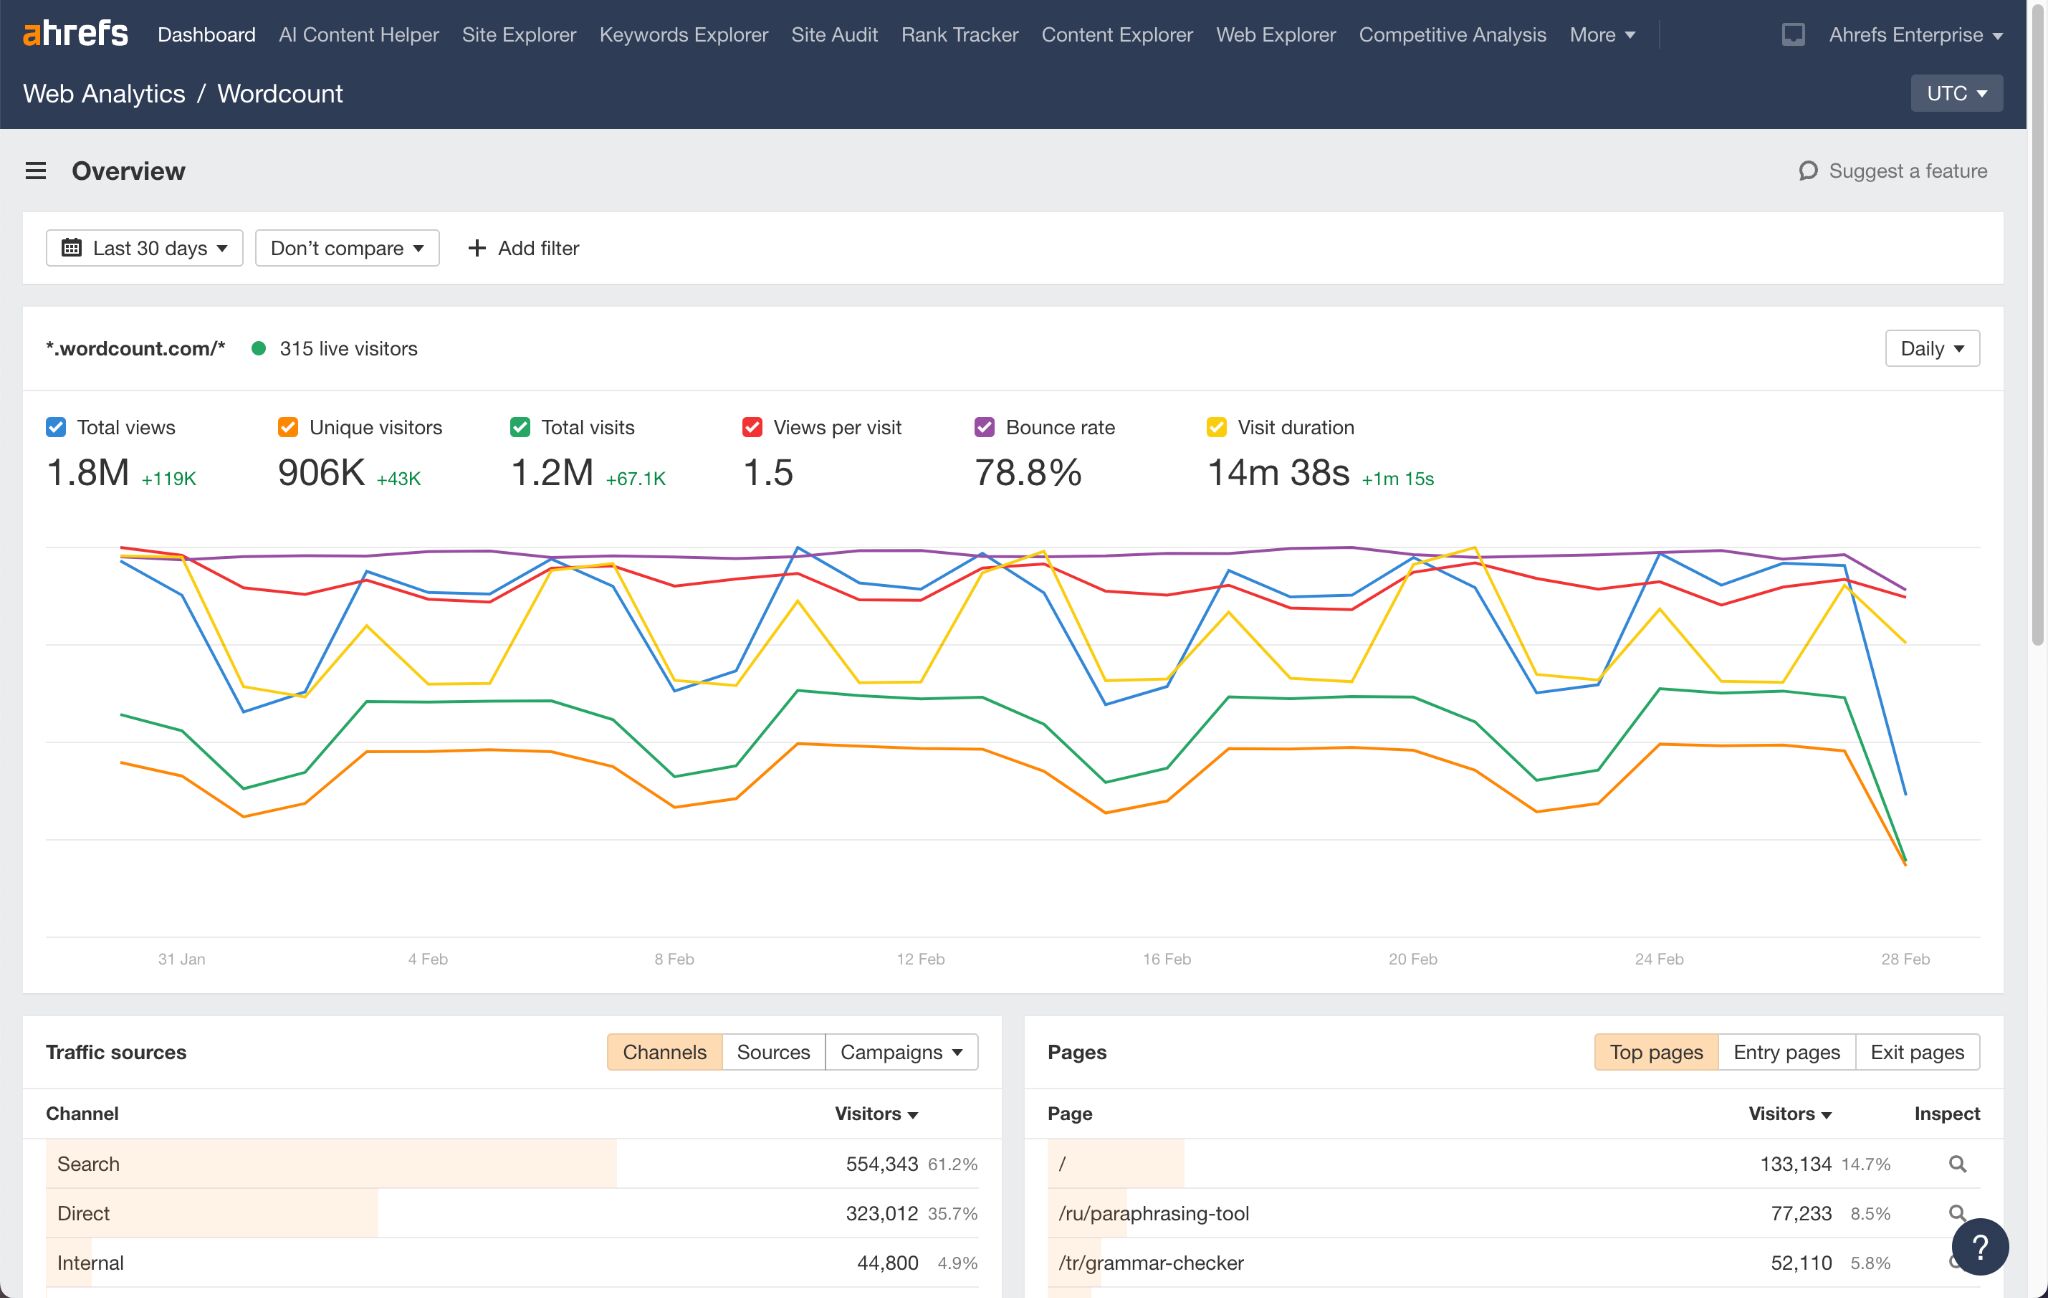
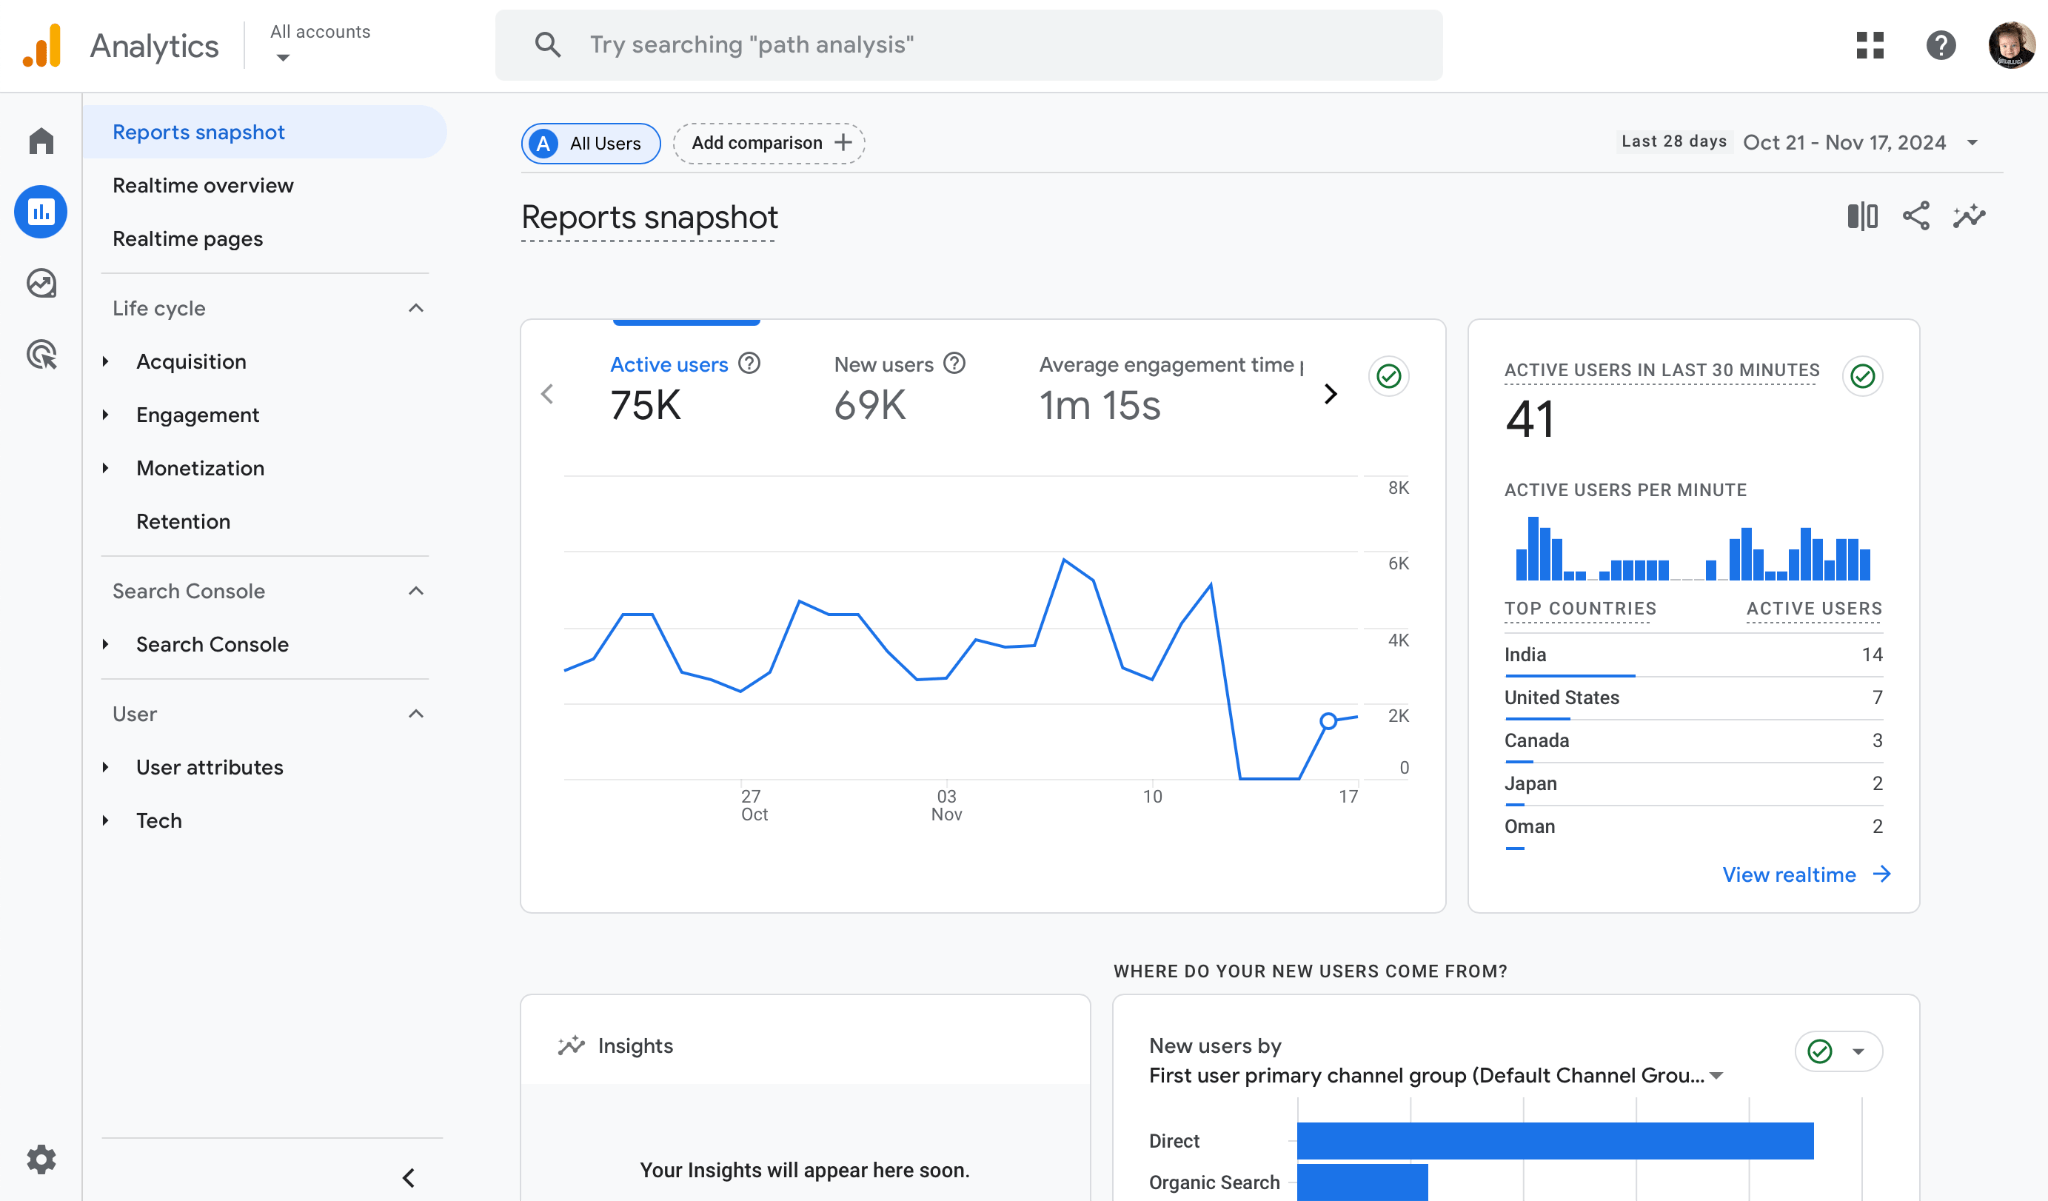
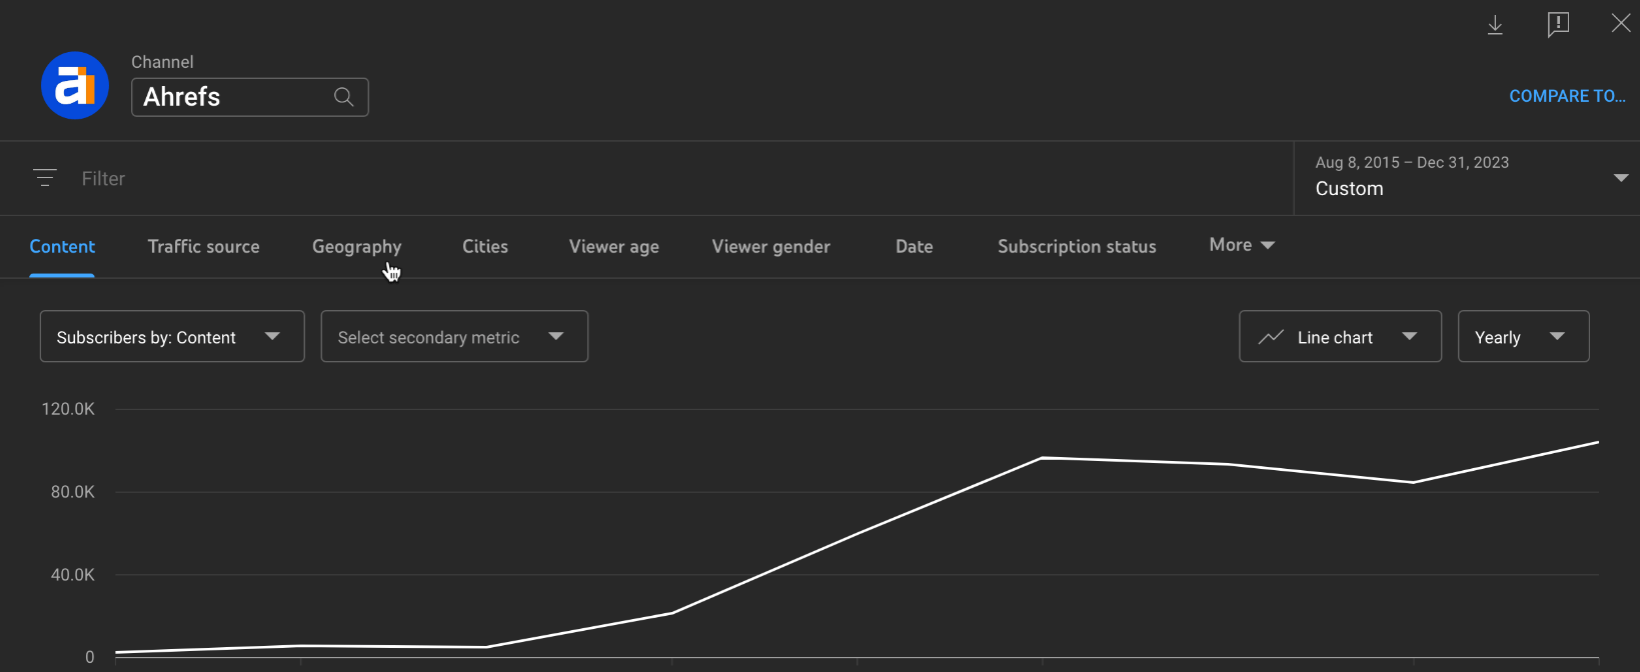
To start, I filled the template with data I took mostly from Website Analytics, part of the free Ahrefs Webmaster Tools. You can use Google Analytics or whatever analytics tool you like.
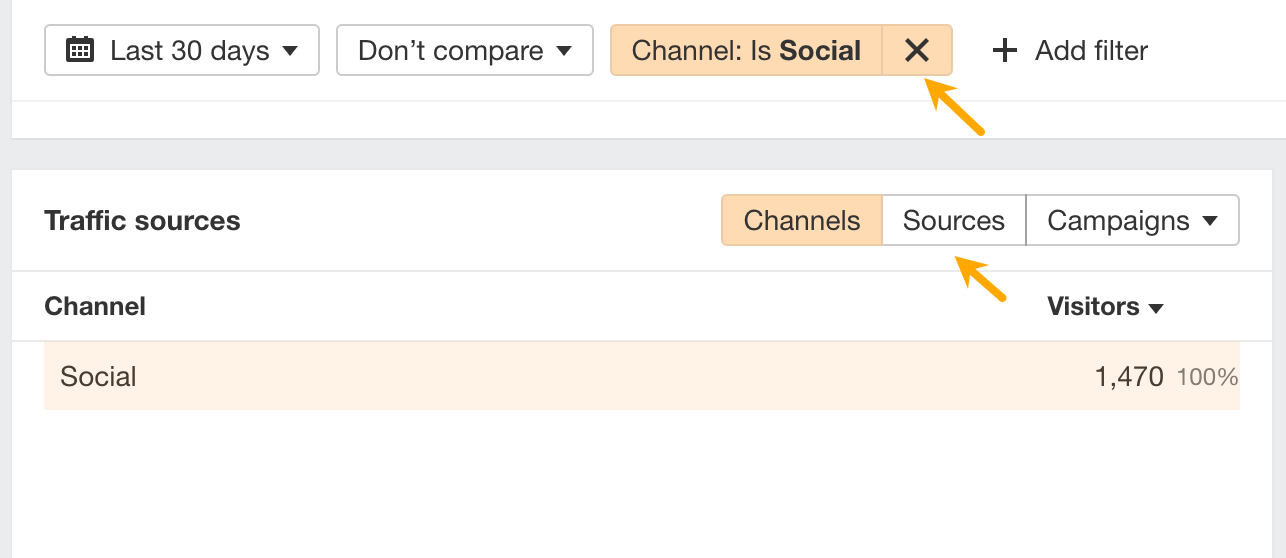
For instance, to get data on visitor behavior coming from YouTube, I picked Social on the list of channels and clicked on the Sources tab (click on the X in the filters above to go back to the previous view).
Next, I downloaded the template from Google Sheets in the xlsx format (use only this format) and uploaded it to the DataDecode bot. For a more seamless process, you can connect the bot to Google Drive or OneDrive.
The bot provided a comprehensive analysis of my metrics across website traffic, social media engagement, paid advertising performance, email marketing results, and revenue figures.
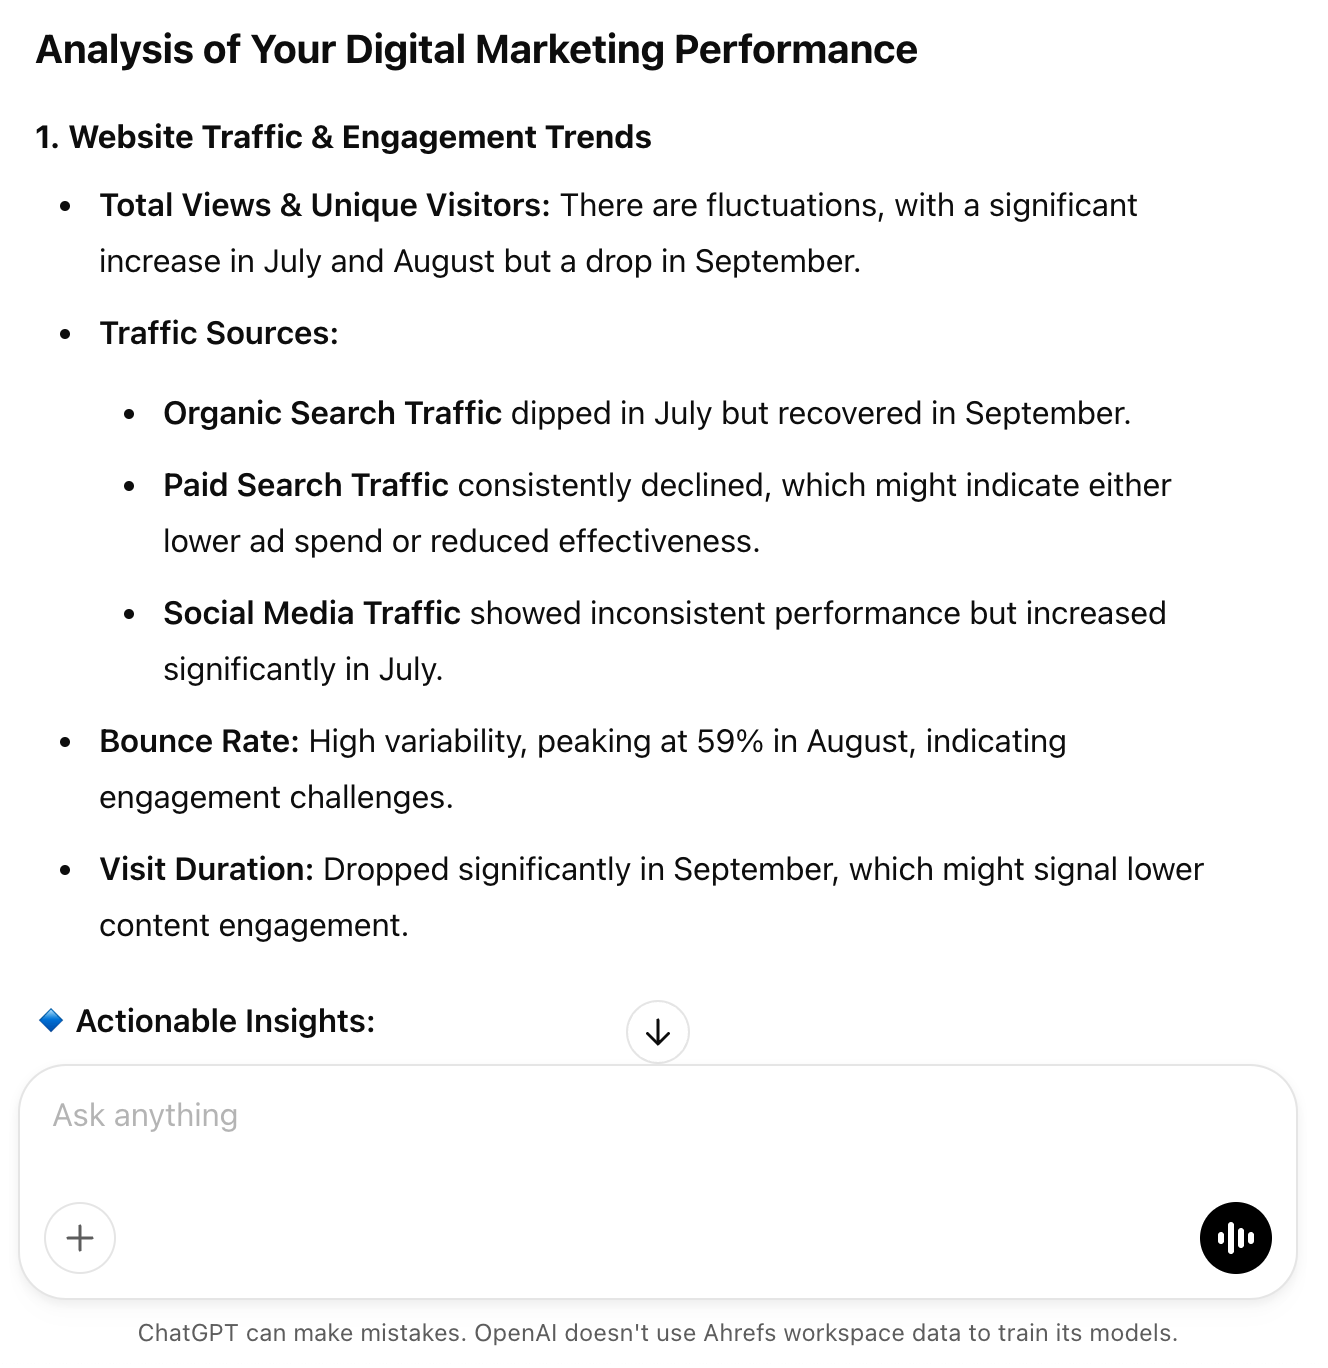
And provided a summary.

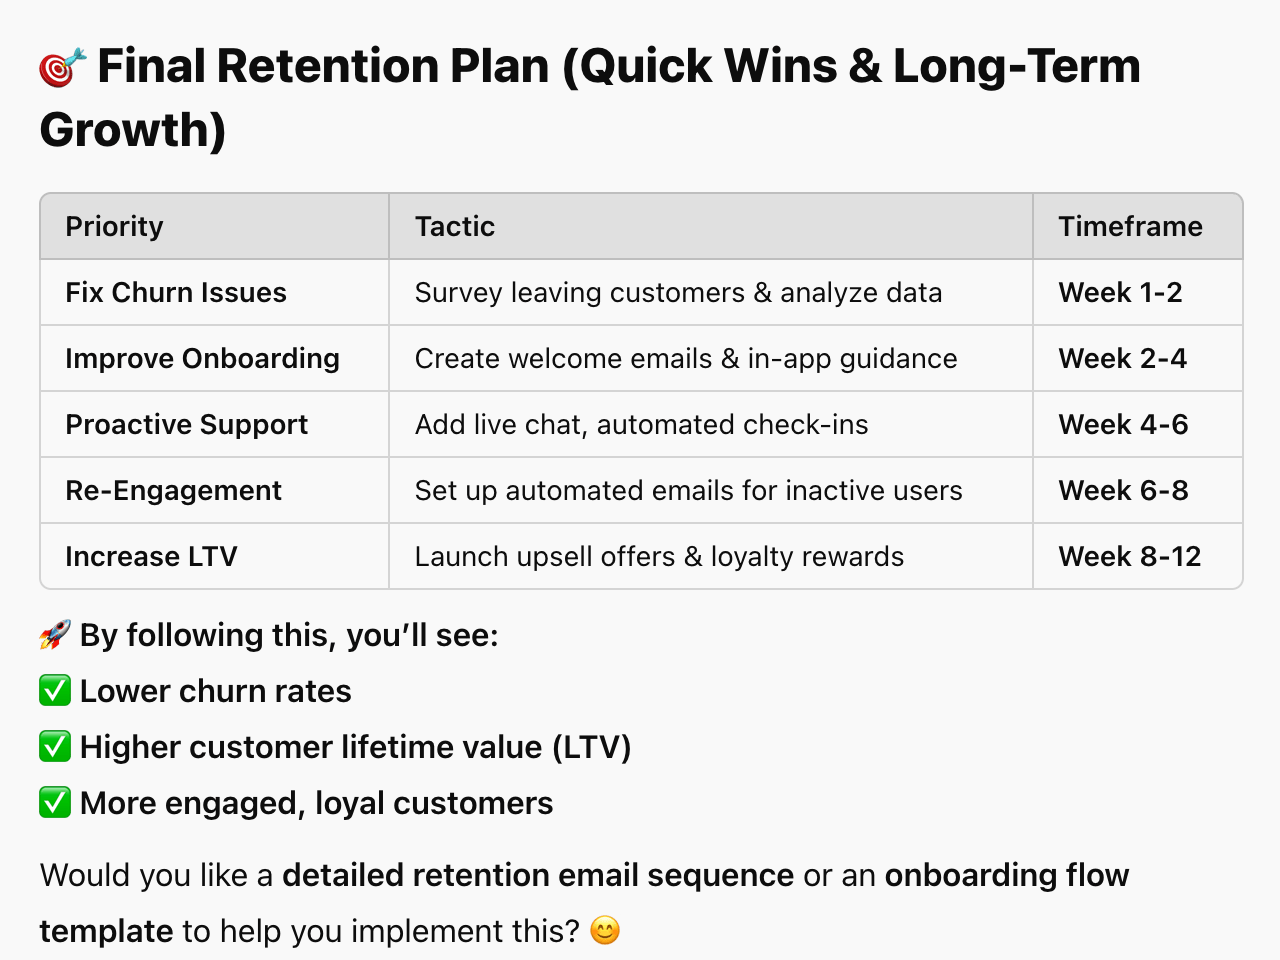
DataDecode mentioned optimizing product engagement, which caught my attention. I asked a follow-up question, and the bot returned a detailed plan, including tactics and even a timeframe.
Just remember, while the bot can crunch your numbers like a pro, it doesn’t know the soul of your product or the marketing tactics you’ve tried. Think of it as a smart advisor giving you a solid starting point and helping you explore options, but trust your gut for the final call.
One last thing — the secret to making sense of all these marketing numbers is sticking with it over time. Your data weaves a story about your business, and you’ll spot the plot twists much easier if you follow along chapter by chapter. Set aside a little time each month to sit down with your metrics.
Try it out and let me know what you think!
Google Analytics (aka GA4): Provides insights into website traffic, user behavior, and conversions.
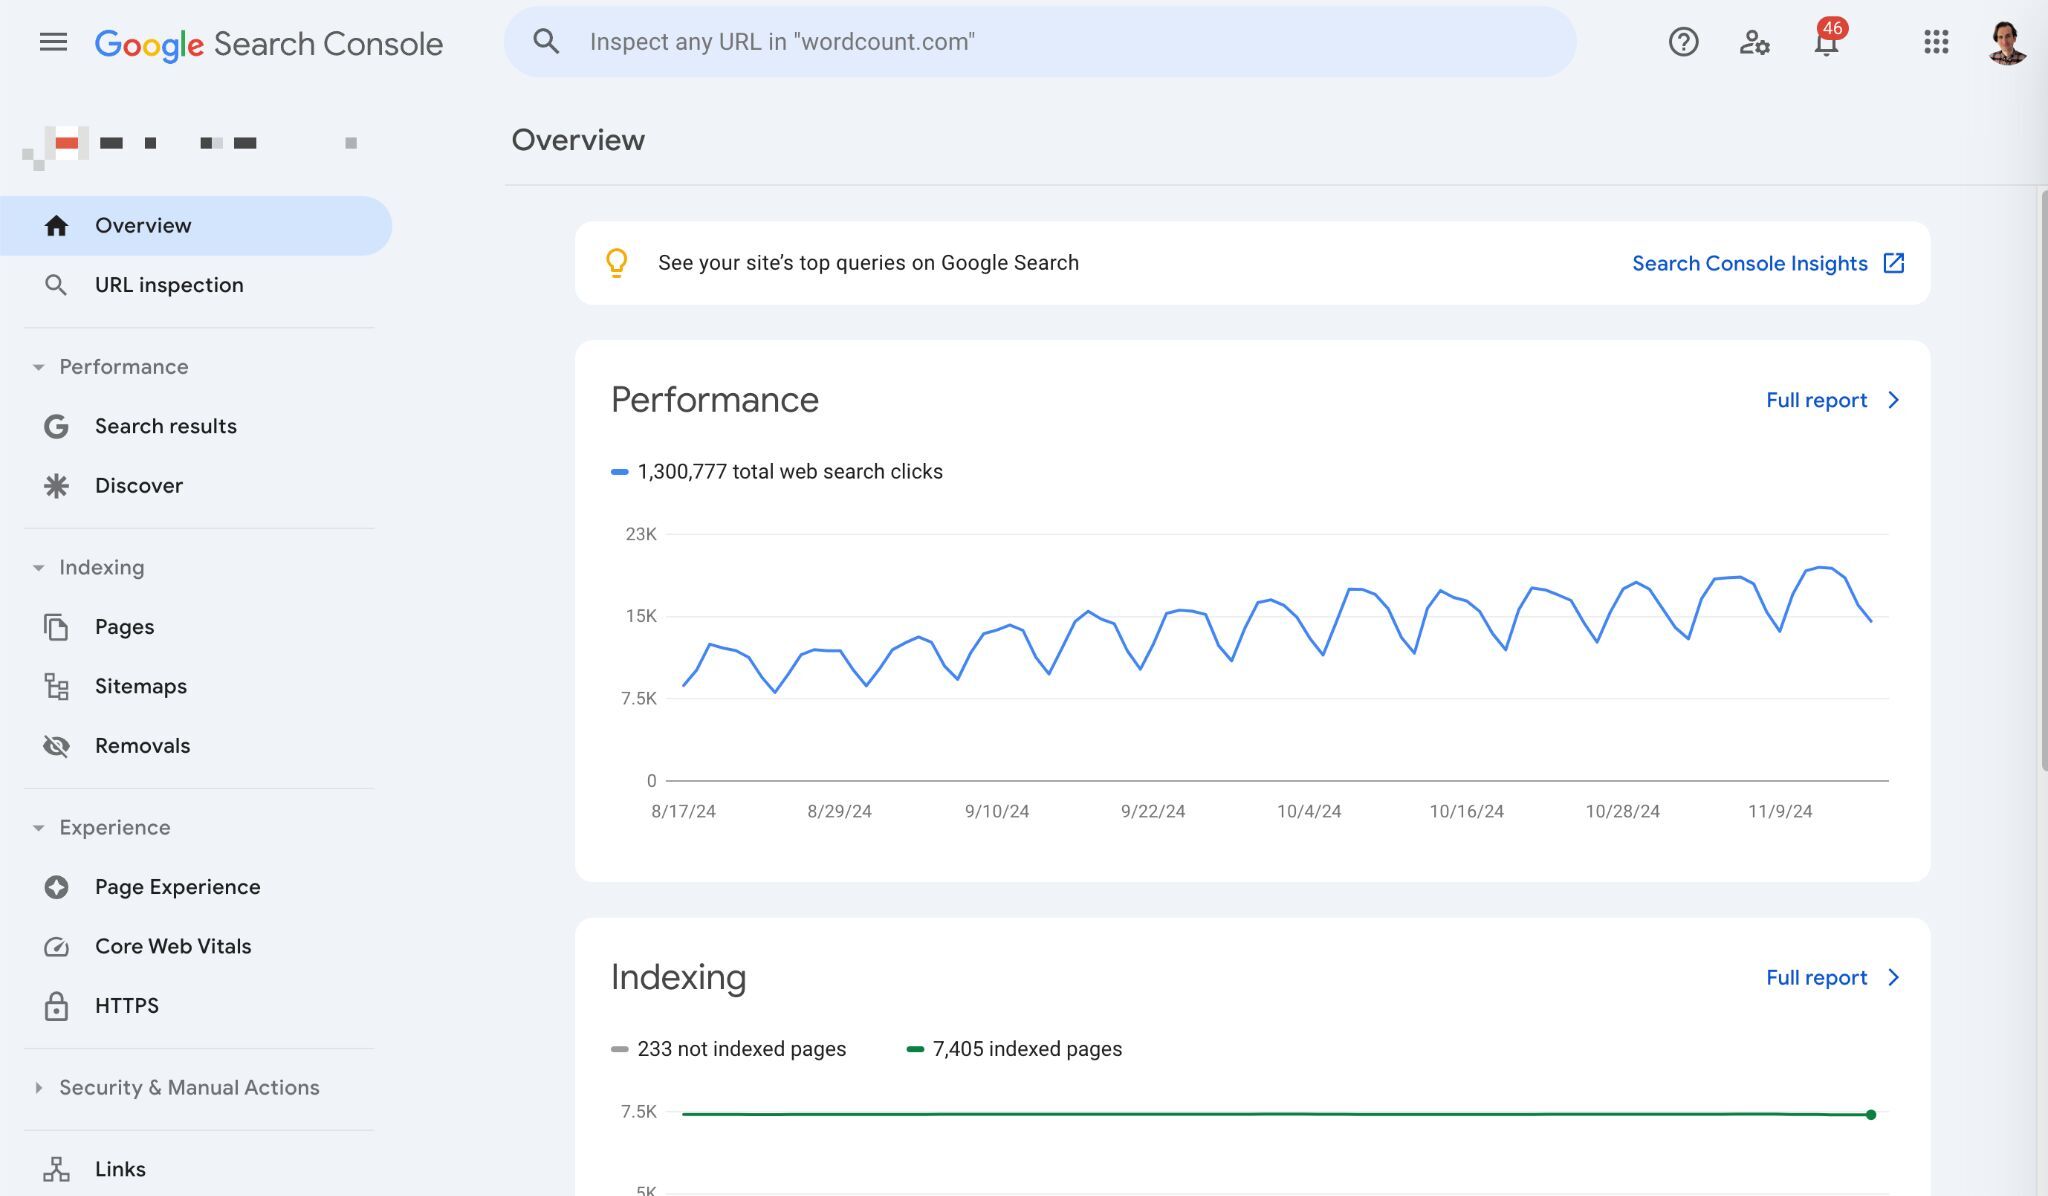
Google Search Console: Helps monitor search performance and site indexing.
Ahrefs Webmaster Tools: This product combines GA4’s essential functionality in a privacy-friendly version with a more robust SEO solution than GSC.

Social media insights: All social media platforms offer free analytics dashboards. You can also use aggregators like Buffer (free plan available).
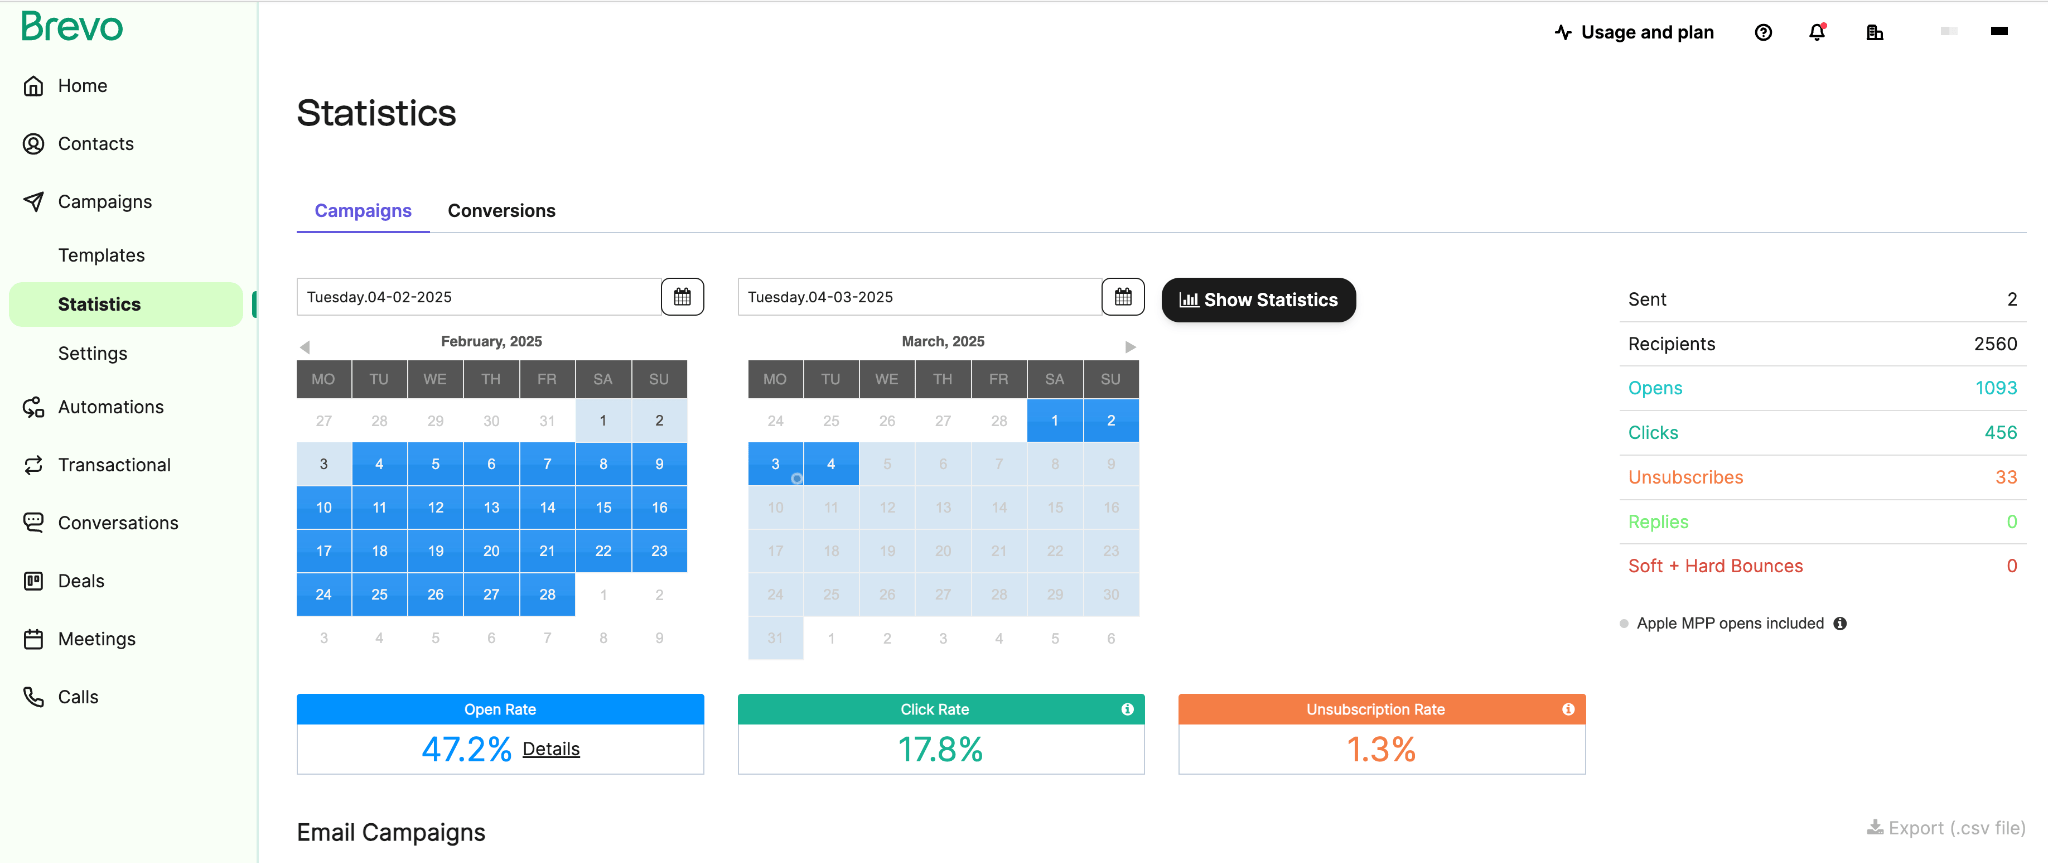
Email marketing platforms: as long as you can get a free account, the essential analytics will be included (for example Brevo, Mailchimp, Mailer Lite).
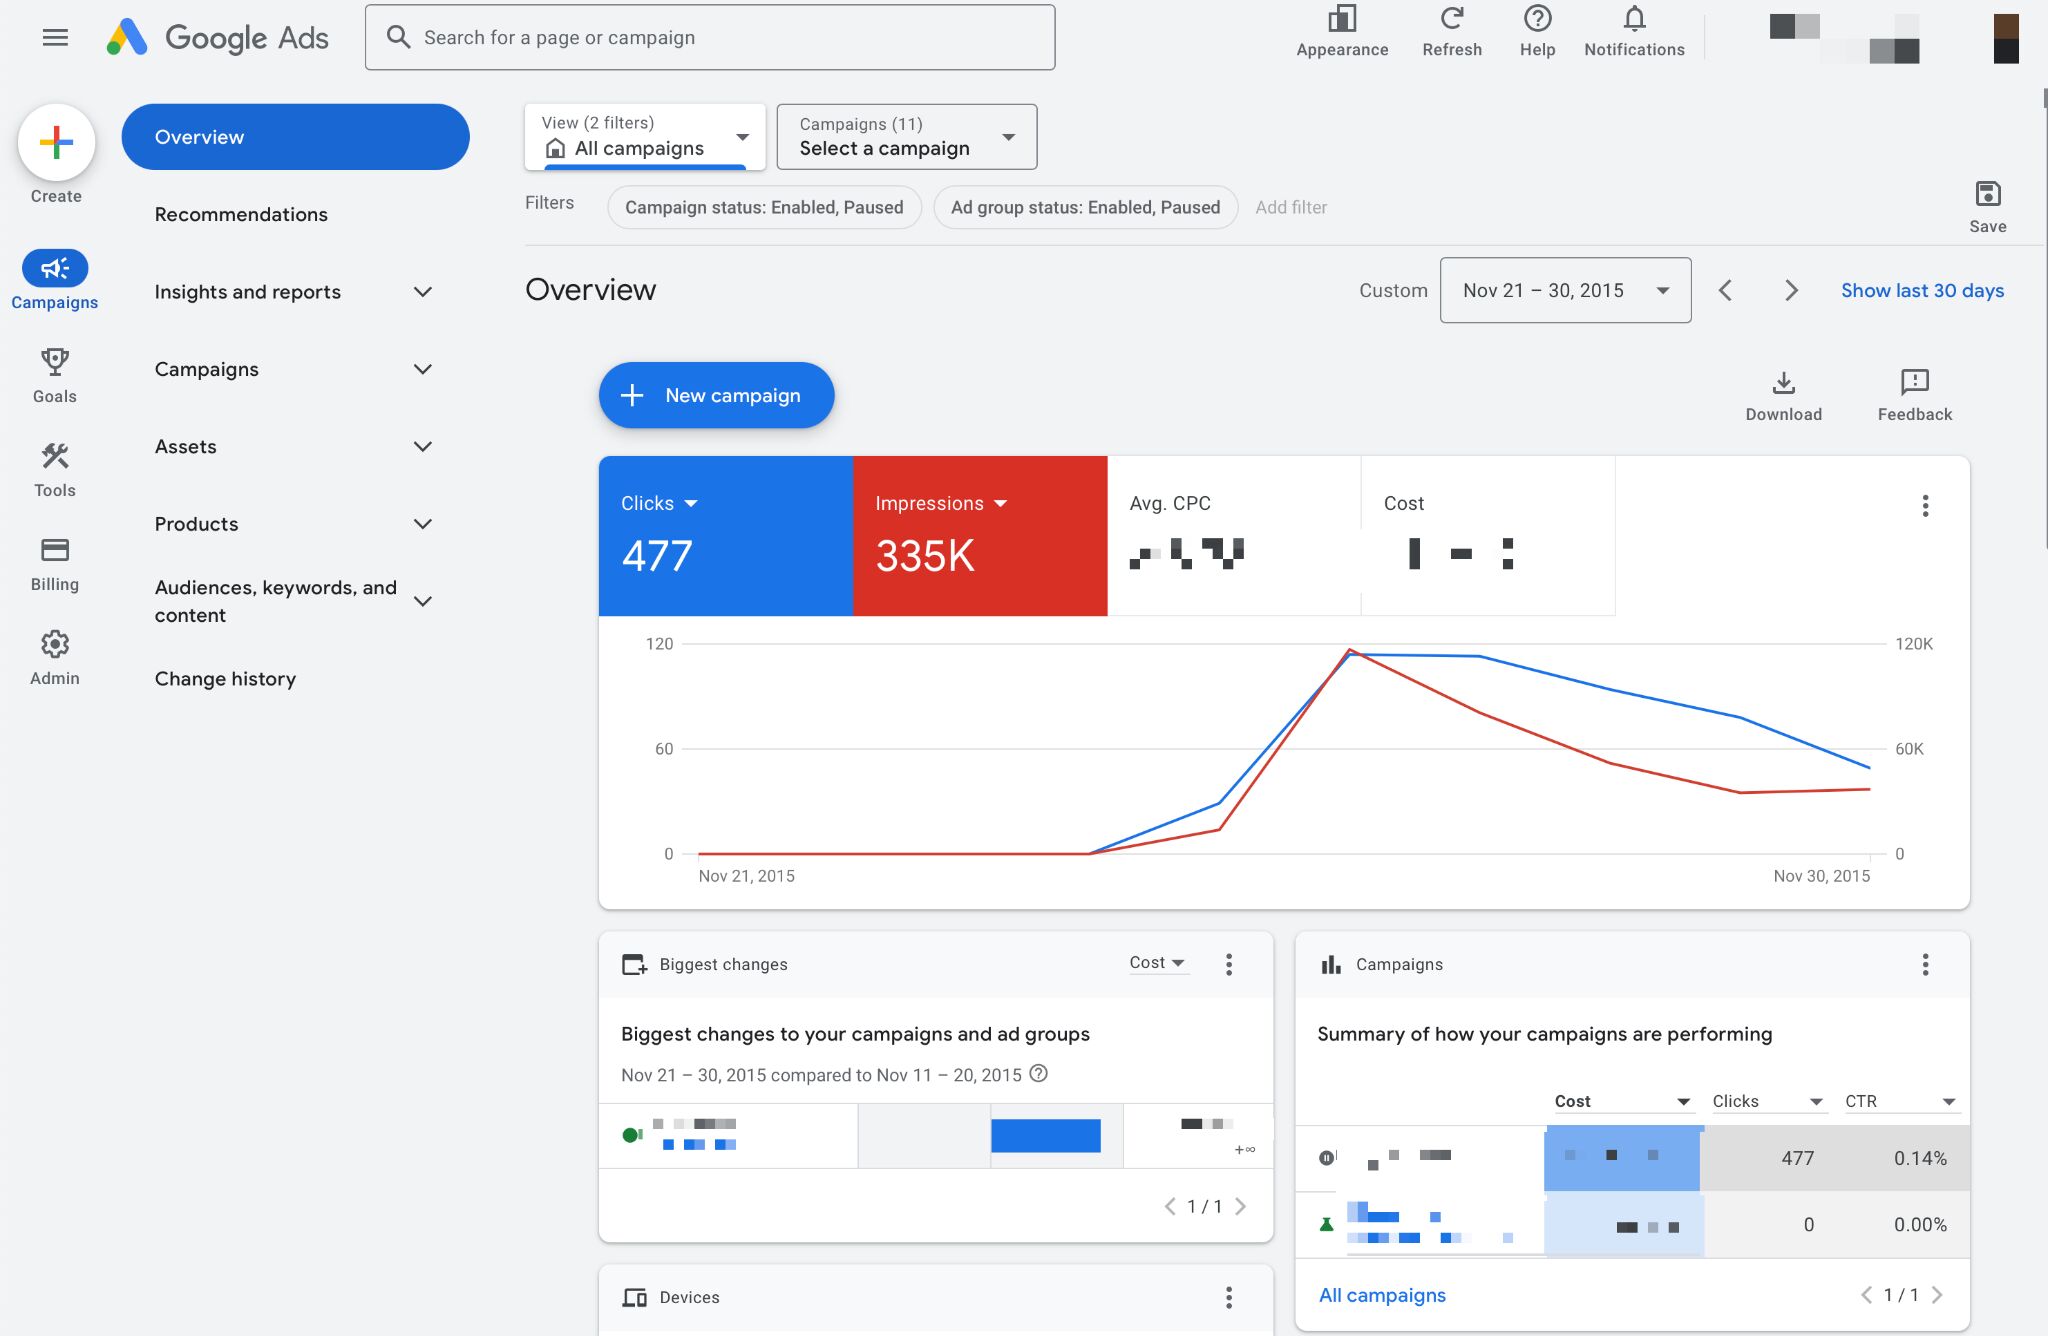
Google Ads & Meta Ads Insights: Tracks ad performance with free reporting tools.
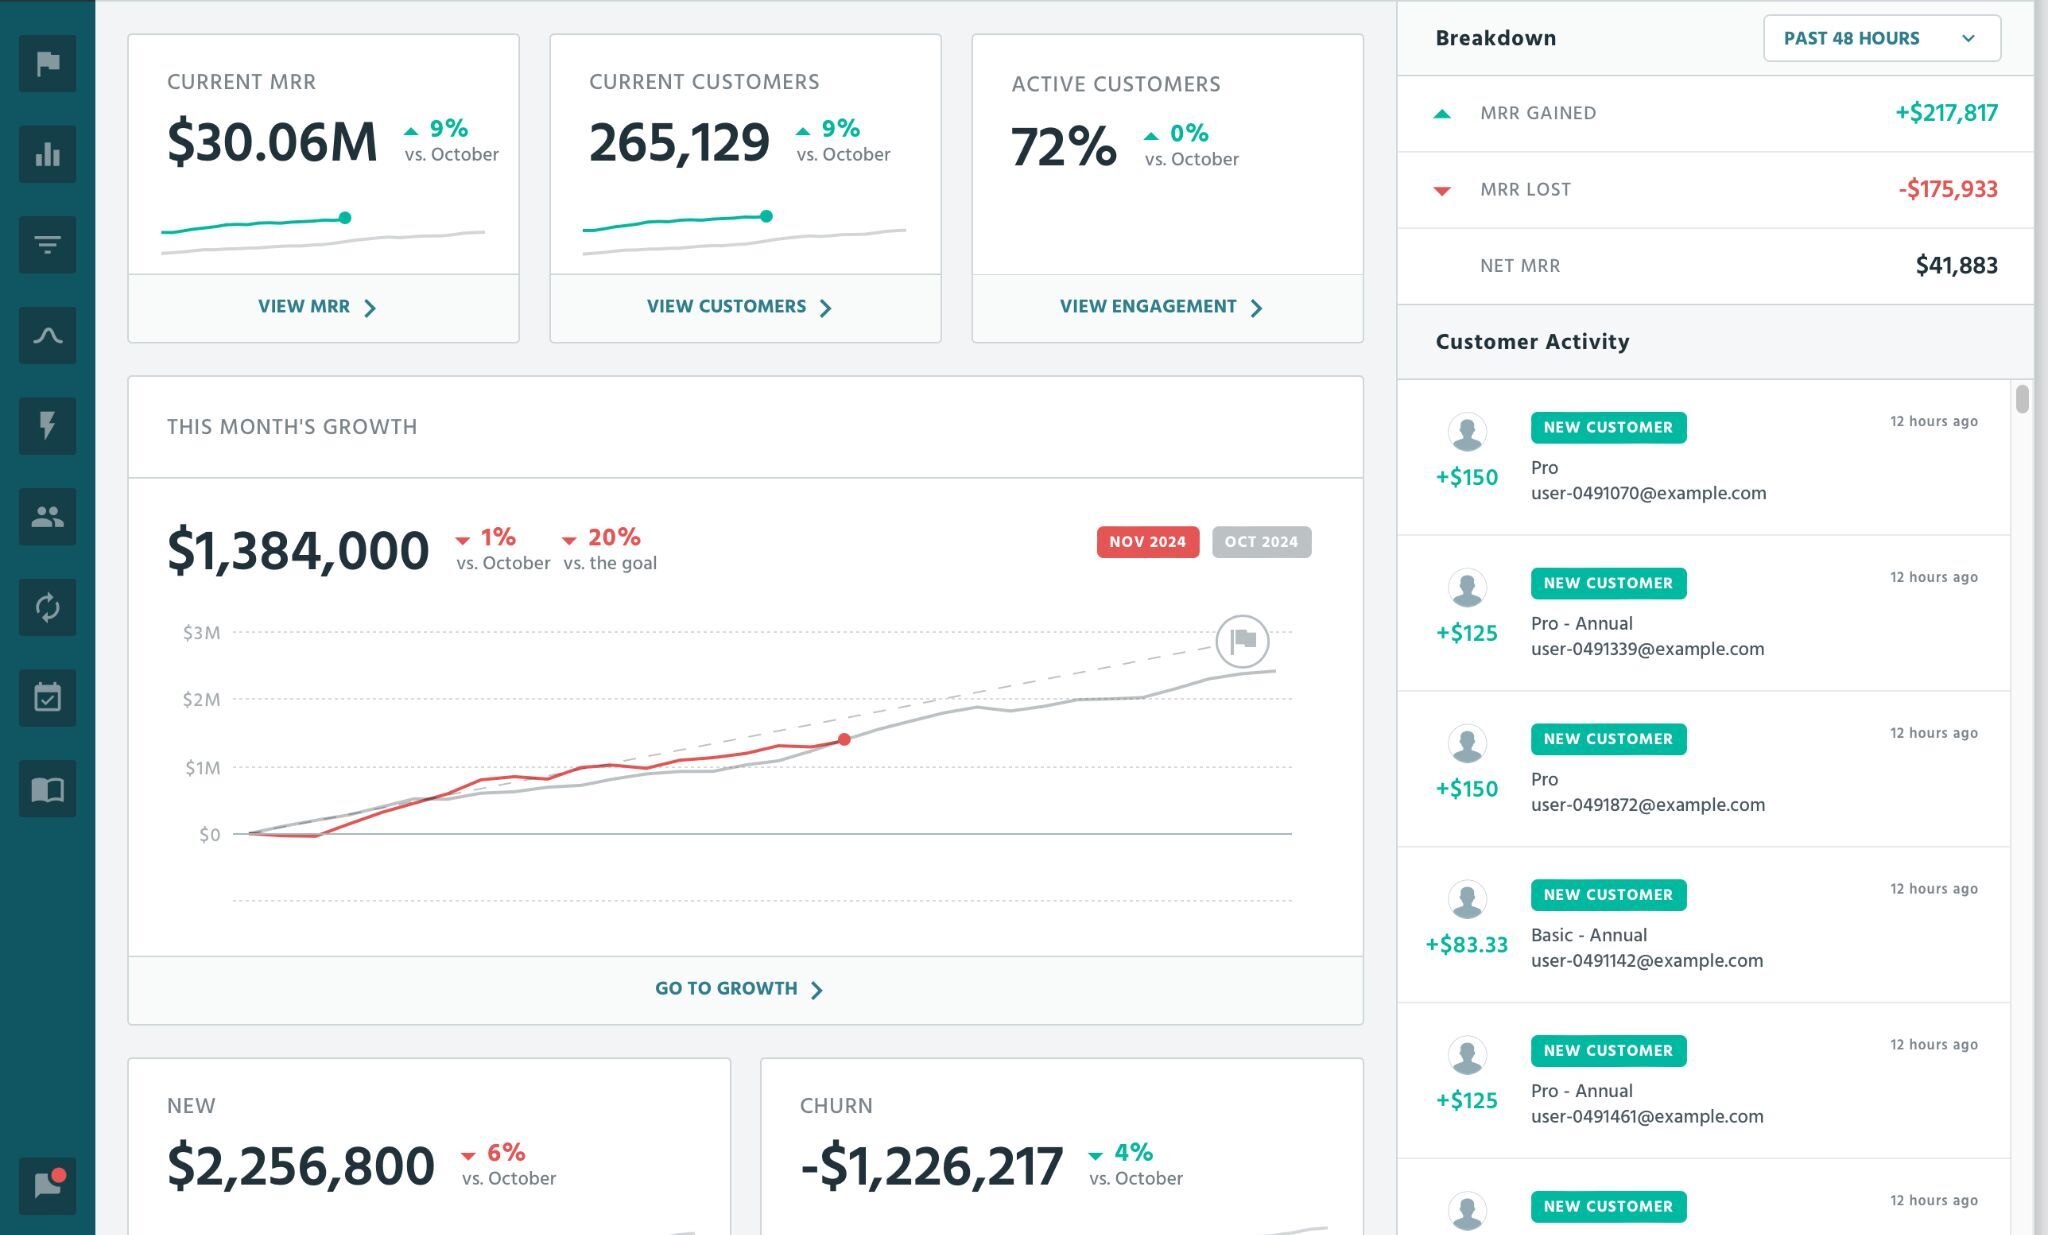
Revenue analytics. Track revenue along with your marketing campaigns to spot correlations. This is especially recommended for SaaS businesses and can be done with free tools like ProfitWell.
Traffic & website analytics
These metrics track how people find and interact with your website.
- Total Views: The total number of times your website was visited.
- Unique visitors: The number of individual people who visited your site (each visitor is counted once).
- Direct Traffic: Typically, visitors who typed your website URL directly into their browser.
- Organic Search Traffic: Visitors who found your site through Google or other search engines.
- Paid Search Traffic: Visitors who clicked on paid Google Ads.
- Social Media Traffic: Visitors who clicked on links from social media platforms.
- Referral Traffic: Visitors who came from other websites linking to yours.
- Bounce Rate: The percentage of visitors who leave after viewing just one page (lower is better).
- Visit Duration: The average time visitors stay on your website.
Social media performance
Measures how your content performs on platforms like LinkedIn & YouTube.
- Traffic from Social Media: The number of website visits from LinkedIn, YouTube, etc.
- Bounce Rate: Shows if visitors from social media are staying or leaving quickly.
- Followers/Subscribers: The total number of people following your brand on social platforms.
- Posts Published: The number of posts/videos you created.
- Watch Hours (YouTube): The total time people spent watching your YouTube videos. High watch hours signal that viewers find your videos valuable enough to stick around, which YouTube’s algorithm rewards with better visibility.
Email marketing performance
Tracks how well your email campaigns are doing.
- Campaigns Sent: The number of campaigns sent to your audience.
- Open Rate: The percentage of recipients who opened your email.
- Click Rate (%): The percentage of recipients who clicked a link inside the email.
- Subscribers (Total): The total number of people on your email list.
- Unsubscribes: The number of people who opted out of your emails.
Paid advertising performance
Tracks the results of your paid marketing campaigns.
- Google Ads Traffic: The number of website visits from Google Ads.
- Google Ads Bounce Rate: The percentage of ad visitors who left after one page.
- Google Ads Visit Duration: The average time visitors from ads stayed on your site.
- Google Ads Spend: The total money spent on Google Ads.
- Affiliate Traffic: Visitors coming from partners or influencers promoting your product.
- Affiliate Spend: Money spent on affiliate partners driving traffic to your site.
Revenue & ROI (Return on Investment)
Measures how much money your marketing efforts are making.
- MRR (Monthly Recurring Revenue): The total revenue earned from subscriptions each month.
- MRR Active: Revenue from active customers.
- MRR Inactive: Revenue from inactive users who haven’t churned yet (i.e. revenue at risk).
- Churn: The number of customers who canceled their subscription.
- Customers: Total number of paying customers.
- Active Customers: Customers currently using your product.
- Trials: People who signed up for a free trial of your product.
What are the types of data analytics in marketing?
There are four main types of data analytics in marketing:
- Descriptive analytics: Shows what happened (e.g., website traffic, engagement rates).
- Diagnostic analytics: Explains why it happened (e.g., attribution analysis).
- Predictive analytics: Forecasts what might happen (e.g., customer lifetime value projections).
- Prescriptive analytics: Recommends what should be done (e.g., automated bidding systems).
As you progress from descriptive to prescriptive analytics, you’ll transform raw data into strategic advantage; turning hindsight into foresight.
What’s the difference between metrics and KPIs?
Metrics are measurements that track specific activities or processes (e.g., page views, click-through rates, time on site). Use them to diagnose tactical issues, understand user behavior patterns, and identify opportunities for optimization at a granular level.
KPIs (Key Performance Indicators) are metrics specifically chosen to measure progress toward strategic business goals (e.g., customer acquisition cost, conversion rate, retention rate). Use them to guide strategic decisions, align team efforts with business priorities, and evaluate the impact of your marketing investments.
How often should I check my marketing analytics?
- Daily/weekly: Monitor campaign performance during active campaigns.
- Monthly: Conduct deeper analysis and adjust strategy if necessary.
- Quarterly: Perform comprehensive big-picture reviews.
What are UTM tags and tracking pixels?
UTM tags are parameters added to URLs to track traffic sources, campaign names, and other attribution data (e.g., utm_source=newsletter).
Tracking pixels are small, invisible images embedded in emails or web pages that load when content is viewed, allowing marketers to track opens, page views, and user behavior.
How does GDPR/CCPA affect my analytics tracking?
Both General Data Protection Regulation (European Union law) and California Consumer Privacy Act regulations require:
- Explicit consent before collecting personal data.
- Clear disclosure about what data is collected and how it’s used.
- Options for users to access, delete, or opt out of data collection.
- Limited data retention periods.
- Proper security measures for stored data.
However, privacy-friendly website analytics like Ahrefs Web Analytics don’t store cookies or personal data, so they significantly reduce your compliance burden under both GDPR and CCPA. Since these privacy-focused analytics solutions avoid collecting personally identifiable information, they may eliminate the need for consent banners in many cases and simplify your privacy policy disclosures.